Introduction to the Sign Test
The Sign Test is a non-parametric method for comparing two related samples when conventional tests can’t be used. It focuses on the direction of changes between paired observations, rather than their numerical differences, to assess median differences.
Key Features of the Sign Test
- Non-parametric Nature: It does not assume a normal distribution of the data, making it suitable for a wide range of datasets, including ordinal data.
- Simplicity: The test relies solely on the signs (+ or -) of the differences between paired observations, disregarding their magnitudes.
- Application: Known as the binomial sign test, it operates under the hypothesis that the probability (p) of observing a positive difference is 0.5, reflecting no systematic bias between the two groups.
Practical Applications: Understanding Consumer Preferences
An example of the Sign Test is comparing preferences between Pepsi and Coke among 10 consumers. By asking participants which brand they prefer and pairing their responses before and after a specific intervention (e.g., a blind taste test), researchers can apply the Sign Test to determine if there is a statistically significant preference for one product over the other.
Need help conducting your analysis? Leverage our 30+ years of experience and low-cost same-day service to complete your results today!
Schedule now using the calendar below.
Assumptions of the Sign Test
- Data Distribution: The test is distribution-free, meaning it does not require the data to follow a specific distribution pattern.
- Sample Origin: The data should originate from two related samples, which could represent the same group under different conditions or times.
- Dependence: One must pair or match samples, often reflecting a ‘before-and-after’ scenario, where the pairing is intrinsic to the research design.
Conducting the Sign Test in SPSS
To perform the Sign Test in SPSS, follow these steps:
- Navigate to the “menu” and select “Analysis”
- Choose “Nonparametric” from the options
- Cling on “Two Related Samples” and select the “Sign Test”
This process allows researchers to easily execute the test within SPSS, providing a user-friendly interface for analyzing paired data.
Conclusion: Evaluating the Sign Test’s Utility
The Sign Test is less powerful than other statistical tests because it focuses on signs rather than magnitudes of change. However, its simplicity and applicability in situations where data do not meet the assumptions of parametric tests make it an invaluable tool for researchers. By enabling the analysis of median differences between paired samples without stringent distributional requirements, the Sign Test facilitates the exploration of research questions across various domains, from consumer preferences to medical studies, where data may not adhere to normal distribution or when numerical data are not available.
Types of sign test:
One sample: We set up the hypothesis so that + and – signs are the values of random variables having equal size.
Paired sample: This test is also an alternative to the paired t-test. This test uses the + and – signs in paired sample tests or in before-after study. In this test, the null hypothesis assumes that the signs of + and – are of equal size, or that the population means are equal to the sample mean.
Procedure:
- Calculate the + and – sign for the given distribution. Put a + sign for a value greater than the mean value, and put a – sign for a value less than the mean value. Put 0 as the value is equal to the mean value; pairs with 0 as the mean value are considered ties.
- Denote the total number of signs by ‘n’ (ignore the zero sign) and the number of less frequent signs by ‘S.’
- Obtain the critical value (K) at .05 of the significance level by using the following formula in case of small samples:
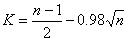
Sign test in case of large sample:
![]()
Binominal distribution formula = ![]() with p =1/2
with p =1/2
- Compare the value of ‘S’ with the critical value (K). If the value of S is greater than the value of K, then the null hypothesis is accepted. If the value of the S is less than the critical value of K, then the null hypothesis is accepted. For large samples, one can compare S with the Z value.
SPSS:
Available in nonparametric tests, the following steps are involved in conducting a sign test in SPSS:
- Click on the “SPSS” icon from the start menu. The following window will appear when we will click on the SPSS icon:

- Click on the “open data” icon and select the data.
- Select “nonparametric test” from the analysis menu and select “two related sample” from the nonparametric option. As we click on the two related samples, the following window will appear:
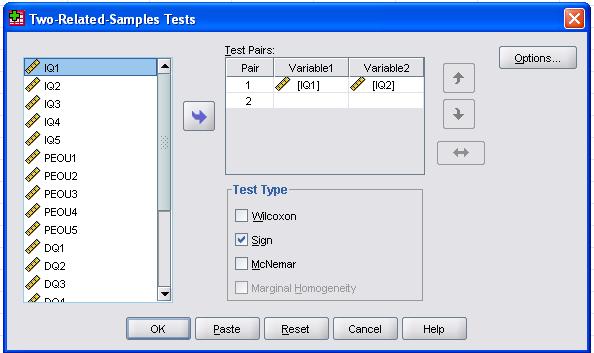
Select the first paired variable and drag it to the right side in variable 1, and select the second paired variable and drag it to the right side in variable 2. Select the “sign test” from the available test. Click on “options” and select “descriptive” from there. Now, click on the “ok” button. The result window for the sign test will appear.
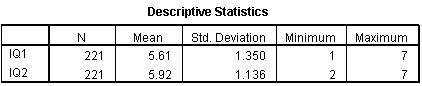
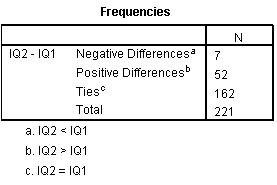
In the result window, the first table will be of the descriptive statistics for sign test. These will include the number of observations per sample, the mean, the SD, the minimum and the maximum value for sign tests in both samples. The second table shows the frequency table. This will show the number of negative sign, the number of positive sign for the number of ties, and the total number of observations. In SPSS, the following table will appear for the descriptive table and frequency:
The third table will show the test statistics table for it. This table shows the value of Z statistic and the probability value. Based on this probability value, we can make our decision about the hypothesis. For example, if the probability value is less than the significance level at .05, null hypothesis will be rejected. If the probability value is greater than the significance level, then cannot reject the null hypothesis. The following table will appear for the test statistics:
Related Analysis: