Conducting a Chi Square Test of Independence in SPSS with Only Frequencies
So let’s say you had some data one two nominal variables and wanted to test the independence between the two variables. However, instead of having the data on an individual-level scale, you had it in the form like what is shown below—in a cross-tabular form. You could compute the chi square test statistic by hand, but this can be cumbersome. However, there is a very simple way in SPSS to conduct the chi square test using only the numbers shown below.
|
Group
| |||
|
Fruit chosen
|
Group 1
|
Group 2
|
Group 3
|
|
Apple
|
10
|
7
|
22
|
|
Orange
|
8
|
19
|
9
|
|
Grape
|
17
|
13
|
12
|

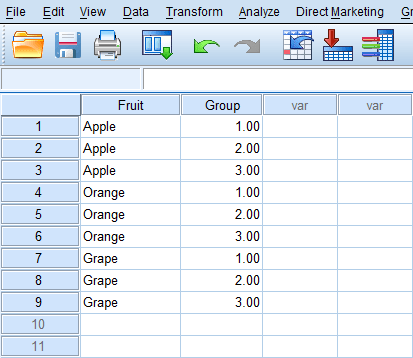
So with this data, we have three groups (1, 2, and 3), and three fruits (apple, orange, and grape). The first thing to do to conduct the chi square test of independence in SPSS would be to set up the two grouping variables. So in SPSS, one variable will be “Apple, Apple, Apple, Orange, Orange, Orange, Grape, Grape, Grape” while the other variable will be “1, 2, 3, 1, 2, 3, 1, 2, 3” as shown below.
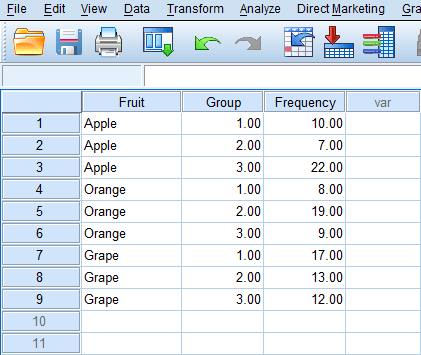
By doing so, we have taken care of each combination of fruit chosen and group. Now the frequencies for each group combination are needed. So the first combination is “Apple, Group 1,” which has a frequency of 10. So simply input “10” for the first item in a new variable. Continue to do this until each fruit chosen and group combination has the correct frequency, as shown below.
|
Fruit * Group Crosstabulation
| |||||
|
Count
| |||||
|
Group
|
Total
| ||||
|
1.00
|
2.00
|
3.00
| |||
|
Fruit
|
Apple
|
10
|
7
|
22
|
39
|
|
Grape
|
17
|
13
|
12
|
42
| |
|
Orange
|
8
|
19
|
9
|
36
| |
|
Total
|
35
|
39
|
43
|
117
|
|
Chi-Square Tests
| |||
|
Value
|
df
|
Asymp. Sig. (2-sided)
| |
|
Pearson Chi-Square
|
15.659a
|
4
|
.004
|
|
Likelihood Ratio
|
15.184
|
4
|
.004
|
|
N of Valid Cases
|
117
| ||
|
a. 0 cells (0.0%) have expected count less than 5. The minimum expected count is 10.77.
|