Advantages of SEM over Regression
The proper selection of methodology is a crucial part of the research study. (Davis, 1996; Stevens, 2002). Structural Equation Modeling (SEM) is a second generation multivariate method that was used to assess the reliability and validity of the model measures. Each statistical technique has certain characteristics that determine applicability to a given problem. Understanding the techniques and their characteristics is essential for selecting the most appropriate approach to the data. This section will discuss why confirmatory factor analysis (CFA) was selected instead of multiple regression.

Discover How We Assist to Edit Your Dissertation Chapters
Aligning theoretical framework, gathering articles, synthesizing gaps, articulating a clear methodology and data plan, and writing about the theoretical and practical implications of your research are part of our comprehensive dissertation editing services.
- Bring dissertation editing expertise to chapters 1-5 in timely manner.
- Track all changes, then work with you to bring about scholarly writing.
- Ongoing support to address committee feedback, reducing revisions.
First generation multivariate methods, like multiple regression, are appropriate for evaluating constructs and relationships between constructs. The terms regression and correlation have been used interchangeably to label a regression analysis, however the intent of a regression analysis is prediction while the intent of a correlation is to assess the relationship between the dependent variable and the independent variables. (Tabachnick & Fidell, 2001, p. 111). Multiple regression is an excellent tool to predict variance in an interval dependent variable, based on linear combinations of interval, dichotomous or dummy independent variables. Interaction terms may be added to the model to measure the joint effect of two variables on a dependent variable, for example, the joint effect of PD*NA on PCTINT in the present model.
Parameter estimates in multiple regression are the unstandardized regression coefficients (β weights).
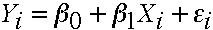
Where Y is the dependent variable, βo and β1 are parameter estimates, Xi is the value of the independent variable, X, for the i-th case and εi is the random error term associated with that particular value of Xi. The value β1 represents the amount the dependent variable Y changes when the independent variables changes by one unit while the other independent variables are held constant.
The powerful technique of matrix algebra is well suited for multivariate regression. Data are arranged such that each row represents one person’s scores or responses on the independent variables. Each column represents the same variable for all subjects or cases. A (I*J) data matrix X consists of measurements of J independent variables on I subjects.

Multivariate regression estimates the same coefficients and standard errors as obtained using separate ordinary least squares (OLS) regressions. In addition, multivariate regression also estimates the between-equation covariances. This means that it is possible to test coefficients across equations. The matrix formula for multivariate regression is identical to the OLS formula. The solution for β that minimizes ε is
B = (X’X)-1X’Y
Where β is a column vector, X’ is the transpose of S, and (X’X) (inverse) is the inverse of (X’X). Using the principle of least squares, the goal is to obtain a solution for β that will minimize ε, the residual error.
Tests of Significance. The proportion of the variance in the dependent variable explained by the independent variables in the model is the coefficient of multiple determination, or R2. R-squared can also be interpreted as the proportionate reduction in error in estimating the dependent variable from the independent variables (Pedhazur, 1982, p. 68). The F test is used to test the significance of R-squared. The “best model” can be determined by comparing the difference between two R-squares when an additional independent variable is added. Relative predictive importance of the independent variables is assessed by comparing the standardized regression coefficients (beta weights). Beta is the average amount the dependent variable changes when the independent variables increases one standard deviation and the other independent variables are held constant. To test the significance of the individual regression coefficients (unstandardized beta), t-tests may be used (but not for dummy variables).
Assumptions. The assumptions for multiple regression include proper specification of the model (omission of pertinent variables can substantially affect the parameter coefficients and the error), interval or near-interval data with unrestricted ranges, linear relationships, and homoscedasticity (the same level or relationship throughout the range of the independent variables).
Meeting the strict assumptions of multiple regression in the current research was not practical or possible, but the main reason for not choosing multiple regression in the current study is that simultaneous evaluation of model construct relationships is not possible; evaluation has to be performed in sequential steps. The introduction of software such as LISREL, AMOS, DEPATH, EQS and RAMONA have fueled the popularity of the methodology.
Second generation multivariate methods (Fornell, 1984; Chin, 1998) allow simultaneous analysis of all the variables in the model instead of separately. In addition, measurement error is not aggregated in a residual error term. Structural equation modeling (SEM) has been applied to a variety of research problems. Within the family of SEM techniques are many methodologies, including covariance-based and variance-based methods. Covariance analysis is also referred to as confirmatory factor analysis (CFA), causal modeling, causal analysis, simultaneous equation modeling, and analysis of covariance structures, path analysis or LISREL. Path analysis and confirmatory factor analysis are special types of SEM; LISREL is the name of a particular software program developed by Karl Jöreskog and Dag Sörbom (1989).
References
Chin, W. (1998). The partial least squares approach for structural equation modeling. In G. A. Marcoulides (Ed.), Modern methods for business research. Mahwah, NJ: Lawrence Erlbaum Associates, 295-336.
Chin, W.W. & Newsted, P.R. (1999). Structural equation modeling analysis with small samples using partial least squares. In R.H Hoyle, Statistical strategies for small sample research. Ca: Sage Publications, 307-341.
Davis, D. (1996). Business research for decision making. Belmont, CA: Duxbury Press.
Fornell, c. (1984). A second generation of multivariate analysis: classification of methods and implications for marketing research.
Pedhazur, E.J. (1982). Multiple regression in behavioral research (2nd ed.). New York: Holt, Rinehart and Winston.
Jöreskog, K.G. and Sörbom, D. (1989). LISREL7: A Guide to the Program and Applications. Chicago: SPSS inc.
Stevens, J. P. (2002). Applied multivariate statistics for the social sciences, Mahwah, New Jersey: Lawrence Erlbaum Associates.
Tabachnick, B.G., Fidell, L.S. (2001). Using multivariate statistics. 4th ed. Needham Heights, MA: Allyn & Bacon.