Spotting the Odd Ones Out: Identifying Outliers in SPSS
Identifying outliers in SPSS is an important step in data analysis as they can have a significant impact on the results of statistical analyses. Outliers are data points that are significantly different from the majority of the data. Measurement errors or data entry errors can cause it. They may also represent legitimate observations that are different from the rest of the data. In this blog post, we will discuss how to identify outliers in SPSS using different methods.
Need help conducting your analysis? Leverage our 30+ years of experience and low-cost same-day service to complete your results today!
Schedule now using the calendar below.
Graphical Representations
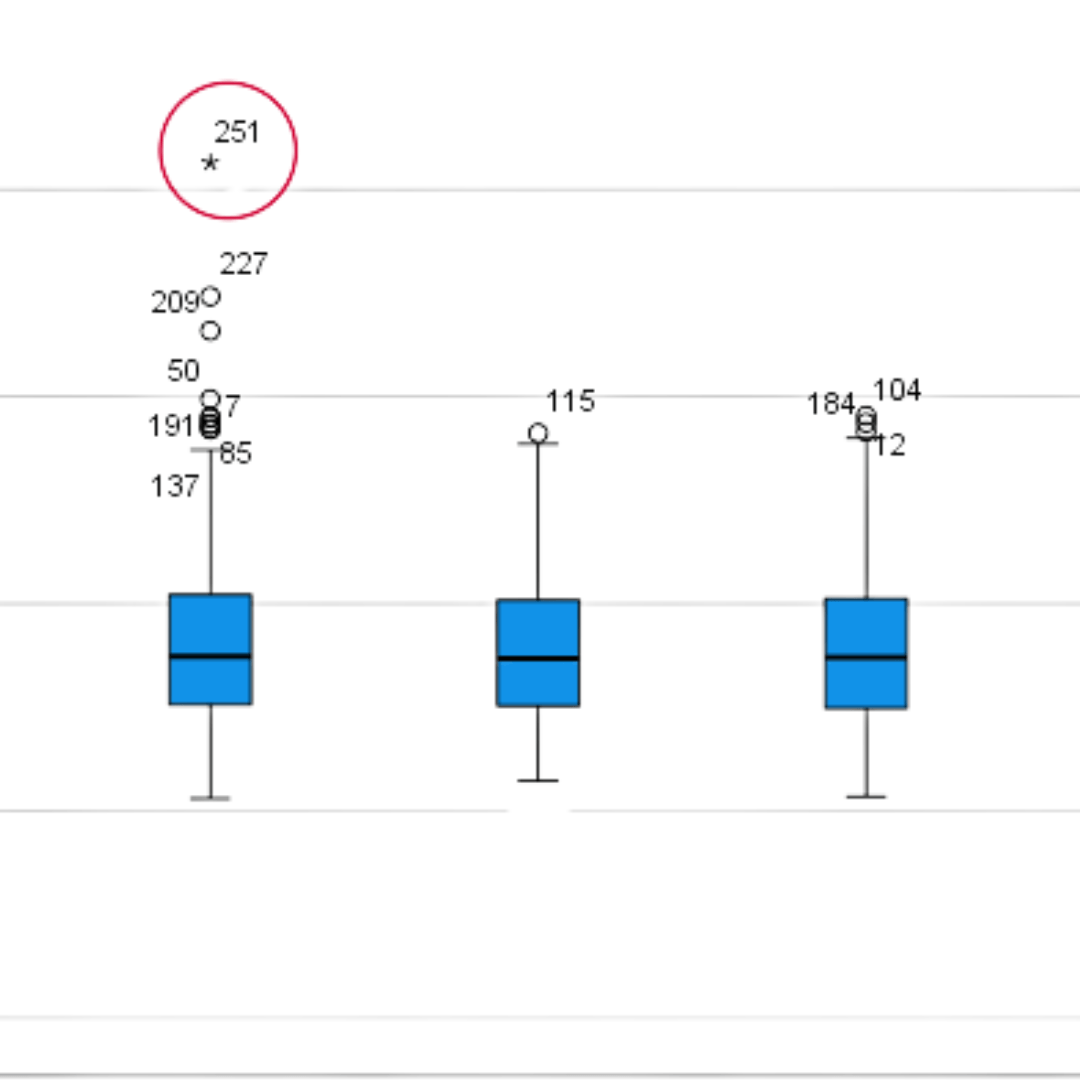
The first way to identify outliers in SPSS is through graphical representations such as boxplots and scatterplots. A box plot is a graphical representation of the distribution of a dataset, which displays the minimum, first quartile, median, third quartile, and maximum. Outliers are typically represented as points outside the box plot. To create a boxplot in SPSS, go to “Graphs” and select “Boxplot.” Select the variable for which you want to create the box plot and click “OK.” A scatter plot is a graph that shows the relationship between two variables. Outliers on a scatterplot are represented as points that strongly deviate from the rest of the data. Similarly to a boxplot, to create a scatter plot in SPSS, go to “Graphs” and select “Scatter/Dot.” Select the two variables you want to compare and click “OK.”
The Z-Score Method
In addition to visual methods, you can also use statistical methods to identify outliers. One such method is the Z-score method. A Z-score is a measure of how many standard deviations a data point is away from the mean. Any Z-score of 3 or more is considered an outlier. This is because a score of 3 or higher falls outside of the range of approximately 99.7% of the data. Therefore, the probability of a Z-score greater than 3 or less than -3 is very low (about 0.3%). To calculate the Z-score for a variable in SPSS, go to “Transform” and select “Compute Variable.” Create a new variable with the formula “Z_score = (variable – mean) / standard deviation” and click “OK.”
Mahalanobis Distance
Additional methods to identify outliers include Mahalanobis distance and Cook’s distances. Mahalanobis distance is a measure of the distance between a point and the mean of a multivariate distribution. To calculate Mahalanobis distance in SPSS, you will need to have a multivariate data set, and you can use the “Mahalanobis” function in SPSS. The result of this function is a value that represents the Mahalanobis distance of each data point from the center of the distribution. A general rule of thumb is that a Mahalanobis distance greater than 3 is considered an outlier.
Cook’s Distances
Cook’s distances, on the other hand, is a measure of the influence of each data point on a regression model, it is used to identify outliers and influential observations. To interpret Cook’s distances, you can compare them to a threshold value, typically 1/ (number of observations – number of parameters) or 4/(number of observations) in a regression model. Any data point with a Cook’s distance greater than this threshold is considered to be an influential observation. It’s important to note that having a large Cook’s distance doesn’t necessarily mean that the observation is an outlier. It means that this observation is having a large effect on the estimates of the regression coefficients, it could be an outlier, but also could be a high leverage point or a combination of both.
Final Remarks
Identifying outliers is an important step in data analysis as they can have a significant impact on the results of your analyses. There are several ways to identify outliers in SPSS, including visual methods such as box plots and scatter plots, and statistical methods such as Z-scores and Mahalanobis distance. By identifying outliers early in the data analysis process, you can ensure that your results are accurate and reliable.

We work with graduate students every day and know what it takes to get your research approved.
- Address committee feedback
- Roadmap to completion
- Understand your needs and timeframe