Moderator Variable
A moderator variable, commonly denoted as just M, is a third variable that affects the strength of the relationship between a dependent and independent variable. In correlation, a moderator is a third variable that affects the correlation of two variables. In a causal relationship, if x is the predictor variable and y is an outcome variable, then z is the moderator that affects the casual relationship of x and y. Most of the moderator variables measure causal relationship using regression coefficient. The moderator, if found to be significant, can cause an amplifying or weakening effect between x and y. In ANOVA, the interaction effect between the dependent variable and the factor variable represents the moderator variable effect.
Questions Answered:
Does gender effectively moderate the relationship between desire to marry and attitudes of marriage?
Does Z treatment effect the impact of X drug onto Y symptoms?
Moderated regression analysis
This regression-based technique identifies the moderator. To explain how MRA technique works, we can use the following example:
Let![]() (1)
(1)![]() (2)
(2)![]() (3)
(3)
Need help with your Moderator Variables? Leverage our 30+ years of experience and low-cost same-day service to complete your results today!
Schedule now using the calendar below.
In this equation, if (the interaction between the independent variable and mediator) is not statistically significant, then Z is not a moderator, it is just an independent variable. If it is statistically significant, Z will act as a mediator, supporting moderation.
Linear vs. non-linear measurement
In a regression equation, when the relationship between the dependent and the independent variables is linear, then the dependent may change when the value of the moderator changes. In a linear relationship, the following equation represents the effect:
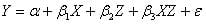
In this equation, the relationship is linear and represents the interaction effect of the moderator and the independent variable. When the relationship is non-linear, the following equation shows the effect of the mediator variable effect:

In this equation, the relationship between the dependent and the independent variable is non-linear, so and shows the interaction effect. In a repeated measure design, you can also use it. In multi-level modeling, a variable that predicts the effect size is the moderator.
- Alternative: In a non-linear relationship, a significant value of a moderator does not prove the true effect. Unless the moderator is a manipulated, we cannot determine if it is true or just a proxy.
- Level of measurement: The moderator is independent that measures the causal relationship. Like other independent variables, you can categorize it or treat it as continuous.
Assumptions
- Causal assumption: When you do not randomize the x variable, you must assume causation. The influencer can reverse the effect of causation if you do not presume the causation between x and y.
- Causal relationship: The mediator and independent , in principal, should not be related. No special interpretation can be found between a correlated independent and moderator variable. However, they should not be too highly correlated, otherwise, estimation problems may occur. The moderator must be related to the dependent variable.
- Measurement: Usually, the moderation effect is represented by the interaction effect between the the dependent and independent variable. In a multiple regression equation, the moderator is as follows:
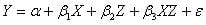
In this equation, the interaction effect between X and Z measures the moderation effect. Typically, if there is no significant relationship on the dependent variable from the interaction between the moderator and independent variable, moderation is not supported.
Related Pages:
- Correlation
- ANOVA
- Multiple Regression
- Take the Course: Mediation and Moderation