McNemar’s Test
Psychology and Statistics department at Stanford University. This non-parametric (distribution-free) test assesses if a statistically significant change in proportions have occurred on a dichotomous trait at two time points on the same population. It is applied using a 2×2 contingency table with the dichotomous variable at time 1 and time 2. In medical research, if a researcher wants to determine whether or not a particular drug has an effect on a disease (e.g., yes vs. no), then a count of the individuals is recorded (as + and – sign, or 0 and 1) in a table before and after being given the drug. Then, McNemar’s test is applied to make statistical decisions (using the Chi Square test statistic) as to whether or not a drug has an effect on the disease.
Procedure:
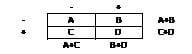
We assume that the row total is equal to the column total. In other words:
(A+B) = (A+C)
(C+D) = (B+D)
In this case, we will cancel the A and D equation and this implies that B=C. By using this equation, we will calculate the test as:
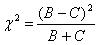
Here, chi-square statistic has with one degree of freedom (df).
Need help conducting your analysis? Leverage our 30+ years of experience and low-cost same-day service to complete your results today!
Schedule now using the calendar below.
Questions Answered:
Is there a change in the proportion of voters prior to and following the press conference?
Does the proportion of success vs. failure significantly change after treatment?
Hypothesis:
Null hypothesis: Assumes that the total rows are equal to the sum of columns. The mean of paired samples are equal and no (significant) change has occurred. In medical research, for example, the null hypothesis assumes that the drug has no impact on disease.
Alternative Hypothesis: Assumes that the total number of rows is not equal to the total number of columns, or that the paired sample means are not equal. In medical research, for example, alternative hypothesis assumes that the drug has an impact on the disease.
SPSS:
To perform McNemar’s test in SPSS, follow the following procedures:
- Click on Analyze then Descriptive Statistics and then Crosstabs
- Click on one of your dichotomous variables into the box marked Row(s)
- Click on one of your dichotomous variables into the box marked Column(s)
- Click on the Statistics button, then check McNemar, then Continue.
- Optional: Click on the Cells button and check Observed under the Counts box and click on the Row, Column boxes under Percentage.
- Click Continue and then OK.
- To determine if a statistically significant change has occurred, looked under the Chi-Square Tests output and check the significance value.
Need More Help?
Check out our online course for conducting a McNemar test here.
Related Pages: