Chi-Square Test of Independence
The Chi-Square test of independence is used to determine if there is a significant relationship between two nominal (categorical) variables. First, you can compare the frequency of each category for one nominal variable across the categories of the second nominal variable. Then, this comparison helps to identify any potential relationship between the two variables. Also, they can display the data in a contingency table, where each row represents a category for one variable and each column represents a category for the other variable.
For example, say a researcher wants to examine the relationship between gender (male vs. female) and empathy (high vs. low). The chi-square test of independence can be used to examine this relationship. Specifically, the null hypothesis for this test states that there is no relationship between gender and empathy. The alternative hypothesis is that there is a relationship between gender and empathy (e.g. there are more high-empathy females than high-empathy males).
Calculate Chi Square Statistic by Hand
First we have to calculate the expected value of the two nominal variables. We can calculate the expected value of the two nominal variables by using this formula:
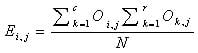
Where
![]() = expected value
= expected value
![]() = Sum of the ith column
= Sum of the ith column
![]() = Sum of the kth row
= Sum of the kth row
N = total number
After calculating the expected value, we will apply the following formula to calculate the value of the Chi-Square test of Independence:
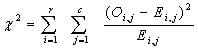
![]() = Chi-Square test of Independence
= Chi-Square test of Independence![]() = Observed value of two nominal variables
= Observed value of two nominal variables![]() = Expected value of two nominal variables
= Expected value of two nominal variables
One can calculate the degrees of freedom using the following formula:
DF = (r-1)(c-1)
Where
DF = Degree of freedom
r = number of rows
c = number of columns
Need help conducting your chi-square? Leverage our 30+ years of experience and low-cost, same-day service to complete your results today!
Schedule now using the calendar below.
Hypotheses
Null hypothesis: Assumes that there is no association between the two variables.
Alternative hypothesis: Assumes that there is an association between the two variables.
Hypothesis testing: Hypothesis testing for the chi-square test of independence as it is for other tests like ANOVA, where a test statistic is computed and compared to a critical value. Initially, you can determine the critical value for the chi-square statistic based on the level of significance (typically .05) and the degrees of freedom. Also, they can calculate the degrees of freedom for the chi-square using the following formula: df = (r-1)(c-1), where r is the number of rows and c is the number of columns. If the observed chi-square test statistic exceeds the critical value, you can reject the null hypothesis.
Related Pages: