What is Hierarchical Linear Modeling?
Hierarchical linear modeling (HLM), also known as multilevel modeling, analyzes data with a hierarchical or nested structure. In this context, we consider data to have a “hierarchical” structure if individual cases (e.g., participants) come from meaningful groups or clusters. A common example of hierarchical data in educational research is grouping students by classroom and/or school.
Example
Need help conducting your Hierarchical Linear Modeling? Leverage our 30+ years of experience and low-cost same-day service to complete your results today!
Schedule now using the calendar below.
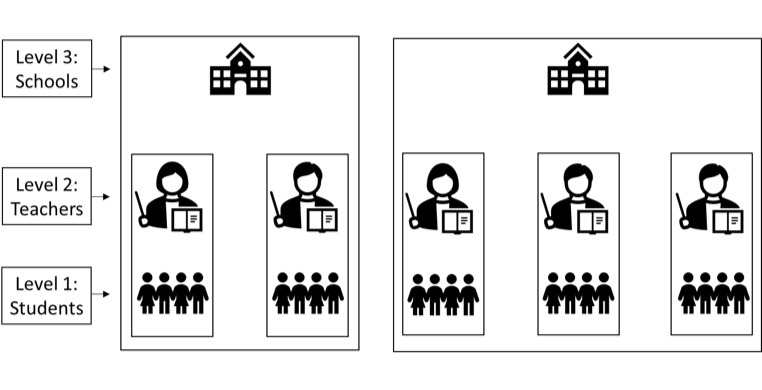
The figure above illustrates this exampIe. In this example we have a three-level data structure: students at Level 1, teachers at Level 2, and schools at Level 3. Data from individual students represent the lowest level of the analysis (Level 1). At Level 1, we might have data such as students’ test scores and demographic characteristics (gender, race, etc.). Students with the same teacher group together at Level 2. The figure above depicts five groups of students, each with one teacher. We group students by teacher, as they may share more similarities, like test scores, than students with different teachers. We include Level 2 variables, like teachers’ experience, and group students and teachers at Level 3.
In the above example, we have two schools: one with two teachers and the other with three teachers. Just as with the student and teacher-level data, we can also include variables measured at the school level, such as school size and the principals’ years of experience.
Students within classrooms and schools is just one example of hierarchical data. Other examples include patients, nurses and doctors grouped by hospital, employees grouped by company, or individuals grouped by family or household. In most research situations, the data will have only two or three levels; however, it is possible to analyze data with more than three levels.
HLM allows us to estimate relationships between variables at multiple levels while accounting for the hierarchical structure of the data. HLM accounts for hierarchical data, even when all variables in the analysis come from Level 1. The reason why we want to account for the data structure is because more basic analyses (e.g., linear regression) assume that all of the observations in the data are independent. If observations group systematically (e.g., students in the same classroom or school), they violate the assumption of independence. Analyses that rely on this assumption may produce biased results when performed on hierarchical data.
Final Remarks
Most major statistical software packages (including SPSS and Intellectus Statistics) are capable of performing HLM. This analysis is a case of mixed-effect modeling, and can be performed in SPSS using the MIXED command. Intellectus Statistics has an analysis option dedicated to HLM and is capable of analyzing two-level data.