Understanding a Repeated Measures ANOVA
What is the Repeated Measures ANOVA?
Repeated Measures ANOVA is a statistical technique used within the ANOVA (ANalysis Of VAriance) framework to compare mean scores across multiple observations of the same subjects. Unlike standard ANOVA, which assesses differences among group means at one point in time or under one condition, Repeated Measures ANOVA evaluates differences across multiple time points or conditions. This method is particularly valuable in studies where the same participants are observed under different conditions or over time.
Key Features of Repeated Measures ANOVA
Dependency: It accounts for the dependencies among repeated observations on the same subjects, which helps in isolating the effect of the independent variable on the dependent variable across different conditions or times.
Multiple Observations: It requires at least one dependent variable that is observed at two or more time points or conditions.
Control of Confounders: By using the same subjects for each condition, it controls for individual differences that could confound the results, such as age, baseline health status, or pre-existing conditions.
Practical Example: Assessing a New Online Travel Booking Tool
Study Setup
Participants: 30 individuals randomly assigned into two groups.
Intervention: One group uses a new online travel booking system while the control group books travel via phone.
Measurements: User acceptance measured over the first four weeks post-launch, focusing on ease of use, perceived usefulness, and effort to use.
Why Use Repeated Measures ANOVA?
In this scenario, Repeated Measures ANOVA allows the research team to assess how user acceptance changes over time and whether these changes are consistent across the two groups. This method effectively handles the interdependence of repeated observations on the same subjects, providing a more accurate analysis of the treatment effect over time compared to multiple ANOVAs which do not account for individual variability.
Need help analyzing your data?
Schedule a time to meet with an expert using the calendar below.
User Friendly Software
Transform raw data to written, interpreted, APA formatted Repeated Measures ANOVA results in seconds.
Comparison to Other Statistical Tests
- Dependent Sample T-Test: Similar in that it compares mean scores between groups over time, but typically used when there are only two time points.
- MANOVA: Could be used to test the influence on each of the weeks independently, but this would not account for the correlation between measurements over time.
Conducting Repeated Measures ANOVA
Key Steps:
- Verify Assumptions: Ensure that there is a direct relationship between observations, the measurements are not random, and each subject has data for all time points.
- Data Structuring: Data must be structured in a way that each row corresponds to a subject and each column to a different time point or condition.
- Model Specification: Specify a model that includes within-subject factors (the different time points or conditions) and any between-subjects factors (such as treatment groups).
- Statistical Analysis: Perform the ANOVA to determine if there are significant differences in the dependent variable across conditions or over time.
Interpreting Results
- Significance Tests: Check if there are significant differences between groups across different times or conditions.
- Effect Size: Determine the size of any observed effects, which provides insight into the practical significance of the results.
- Post-Hoc Tests: If significant effects are found, post-hoc tests may be needed to explore differences between specific conditions or time points.
Conclusion
Repeated Measures ANOVA is a robust analytical tool for studies where the same subjects are assessed under varying conditions or across multiple time points. It offers the advantage of controlling for inter-subject variability and is particularly useful in longitudinal studies, clinical trials, and other experimental designs where measuring changes within subjects over time is crucial. Understanding how to properly conduct and interpret this test ensures accurate insights into the dynamics of the data, enabling researchers to make informed conclusions about their studies.
The Repeated Measures ANOVA in SPSS
Let us return to our aptitude test question in consideration of the repeated measures ANOVA. The question being: “Is there a difference between the five repeated aptitude tests between students who passed the exam and the students who failed the exam?” Since we ran the aptitude tests multiple times with the students these are considered repeated measurements. The repeated measures ANOVA uses the GLM module of SPSS, like the factorial ANOVAs, MANOVAs, and MANCOVAs.
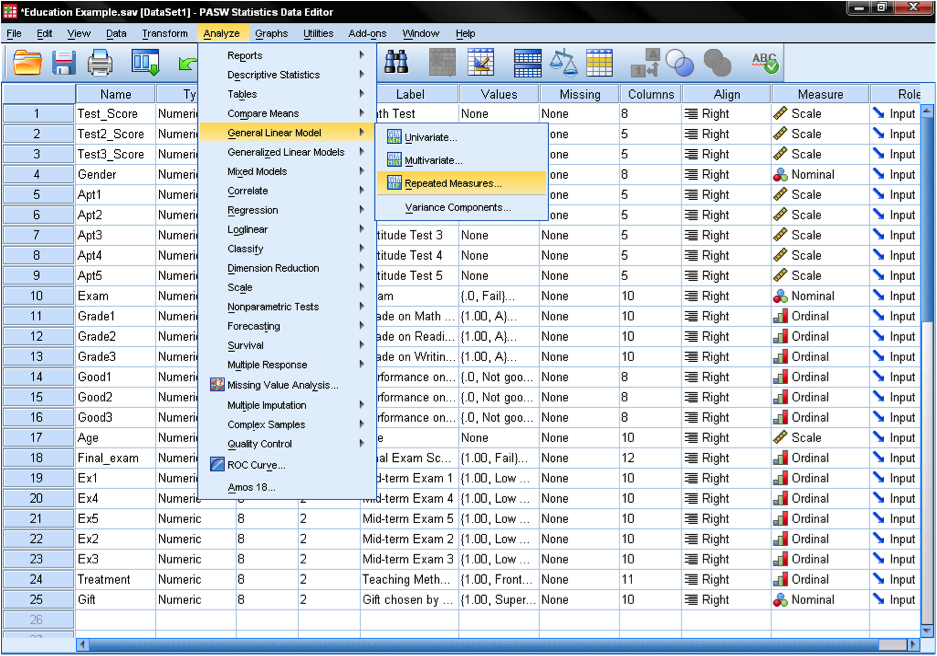
The repeated measures ANOVA can be found in SPSS in the menu Analyze/General Linear Model/Repeated Measures…
The dialog box that opens on the click is different than the GLM module you might know from the MANOVA. Before specifying the model we need to group the repeated measures.
We specify the repeated measures by creating a within-subject factor. It is called within-subject factor of our repeated measures ANOVA because it represents the different observations of one subject (so the measures are made within one single case). We measured the aptitude on five longitudinal data points. Therefore we have five levels of the within-subject factor. If we just want to test whether the data differs significantly over time we are done after we created and added the factor Aptitude_Tests(5).
The next dialog box allows us to specify the repeated measures ANOVA. First we need to add the five observation points to the within-subject variables simply select the five aptitude test points and click on the arrow pointing towards the list of within-subject variables. In a more complex example we could also include additional dependent variables into the analysis. Plus we can add treatment/grouping variables to the repeated measures ANOVA, in such a case the grouping variable would be added as a between-subject factor.
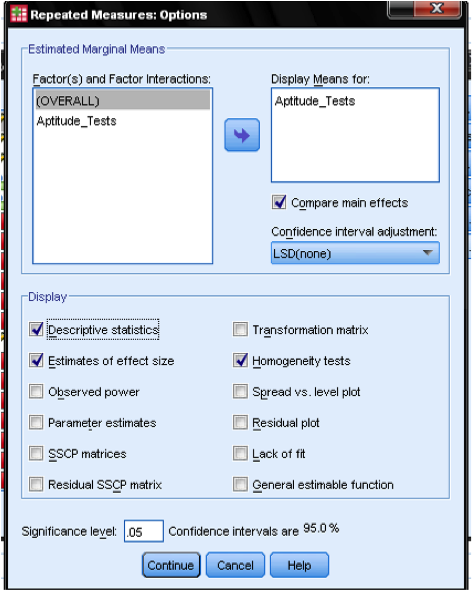
Since our example does not have an independent variable the post hoc tests and contrasts are not needed to compare individual differences between levels of the between-subject factor. We also go with the default option of the full factorial model (in the Model… dialog box). If you were to conduct a post hoc test, SPSS would run a couple of pairwise dependent samples t-tests. We only add some useful statistics to the repeated measures ANOVA output in the Options… dialog.
Technically we only need the Levene test for homoscedasticity when we would include at least one independent variable in the sample. However it is checked here out of habit so that we don’t forget to select it for the other GLM procedures we run.
It is also quite useful to include the descriptive statistics, because we have not yet compared the longitudinal development of the five administered aptitude tests.
Take the Course: Repeated Measures ANOVA
Statistics Solutions can assist with your quantitative analysis by assisting you to develop your methodology and results chapters. The services that we offer include:
- Edit your research questions and null/alternative hypotheses
- Write your data analysis plan; specify specific statistics to address the research questions, the assumptions of the statistics, and justify why they are the appropriate statistics; provide references
- Justify your sample size/power analysis, provide references
- Explain your data analysis plan to you so you are comfortable and confident
- Two hours of additional support with your statistician
Quantitative Results Section (Descriptive Statistics, Bivariate and Multivariate Analyses, Structural Equation Modeling, Path analysis, HLM, Cluster Analysis)
- Clean and code dataset
- Conduct descriptive statistics (i.e., mean, standard deviation, frequency and percent, as appropriate)
- Conduct analyses to examine each of your research questions
- Write-up results
- Provide APA 7th edition tables and figures
- Explain Chapter 4 findings
- Ongoing support for entire results chapter statistics
Please call 727-442-4290 to request a quote based on the specifics of your research, schedule using the calendar on this page, or email [email protected]


