Identifying Multivariate Outliers in SPSS
Multivariate outliers can be a tricky statistical concept for many students. Multivariate outliers are typically examined when running statistical analyses with two or more independent or dependent variables. Here we outline the steps you can take to test for the presence of multivariate outliers in SPSS.
1) Identify what variables are in linear combination. This could be, for example, a group of independent variables used in a multiple linear regression or a group of dependent variables used in a MANOVA.
Need help conducting your analysis? Leverage our 30+ years of experience and low-cost same-day service to complete your results today!
Schedule now using the calendar below.
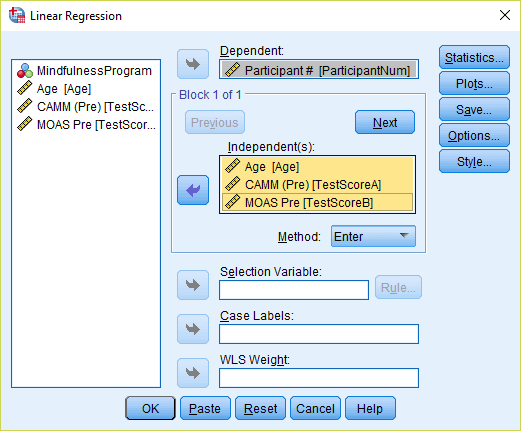
3) The dependent variable does not matter in this analysis, so move any scale level variable into this box (you can simply enter participant ID numbers as the dependent variable if there are no scale variables available in your data). Move the variables that you want to examine multivariate outliers for into the independent(s) box.
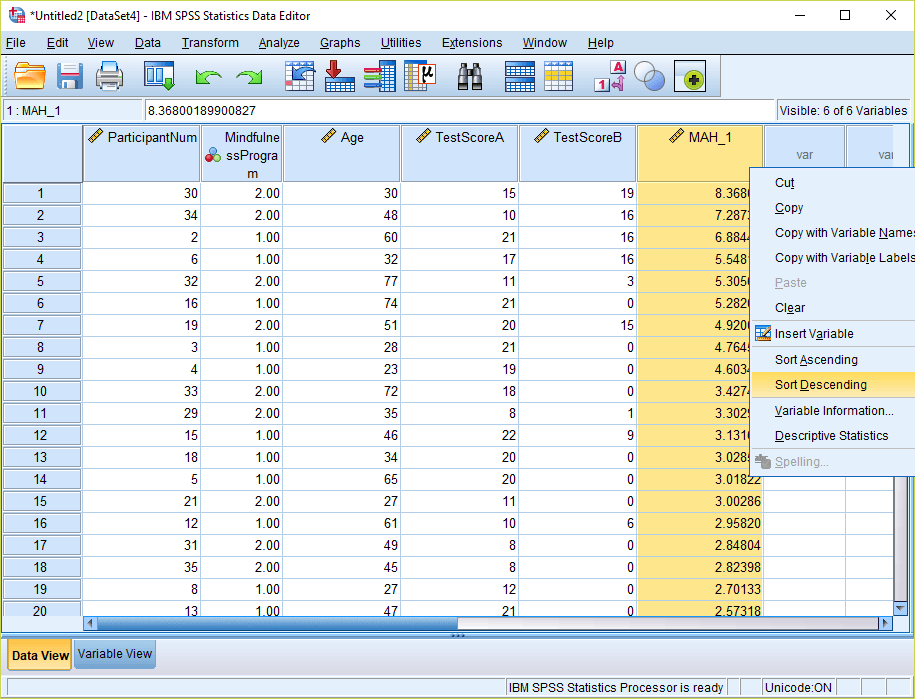
4) Click the “Save…” option in the Linear Regression menu, and check mark “Mahalanobis Distances.” Then click Continue. Then click OK to run the linear regression. This will generate a new variable in your spreadsheet with the default name “MAH_1” – corresponding to the Mahalanobis Distances for the combination of independent variables you selected. Sort this column in descending order so the larger values appear first.
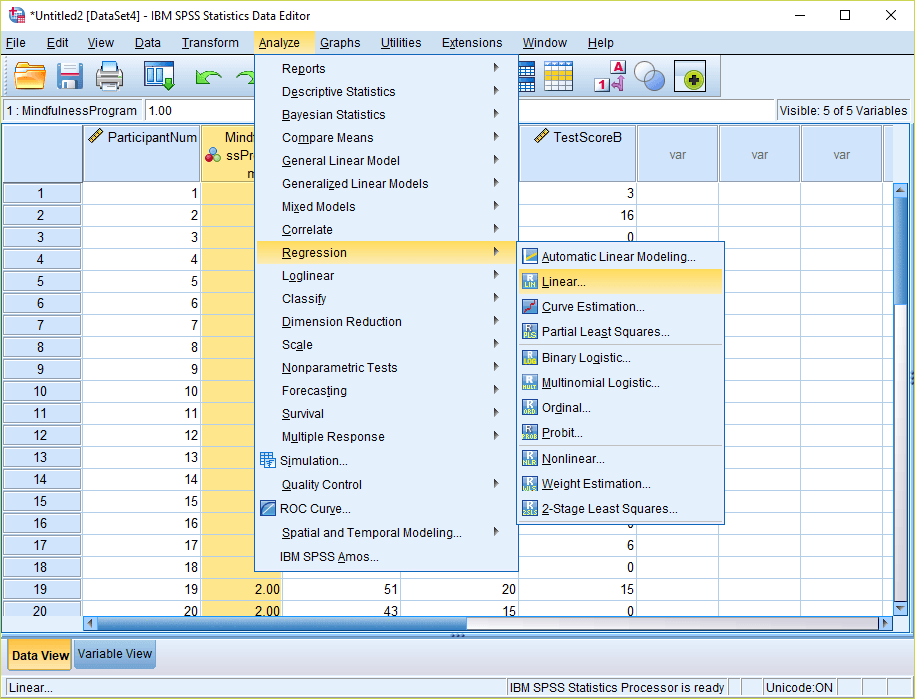
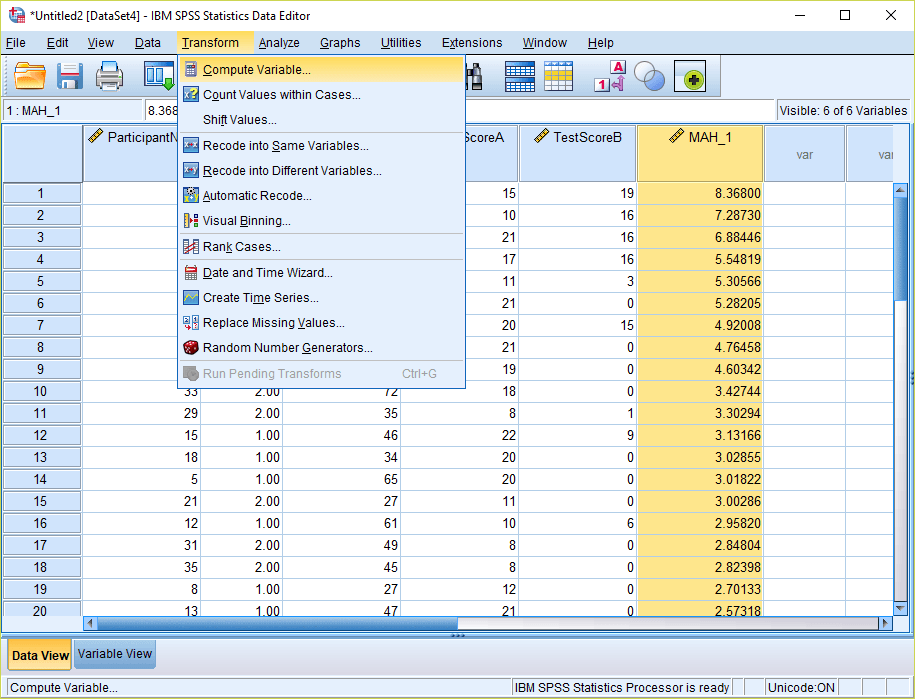
5) Now we want to compare these Mahalanobis Distances to a chi-square distribution with the same degrees of freedom. The degrees of freedom will correspond to the number of variables you have grouped together to calculate the Mahalanobis Distances (in this care three: Age, TestScoreA, and TestScoreB). Then go to Transform > Compute Variable…
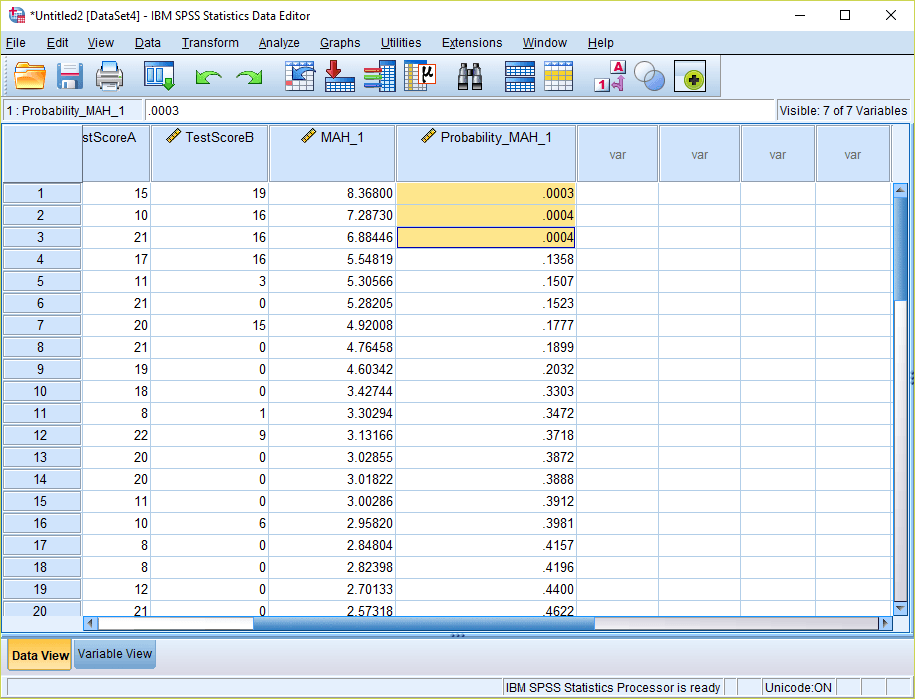
6) Give your target variable a name – for example “Probability_MAH_1”. Now write the expression: 1 – CDF.CHISQ(X1, X2). For X1, substitute the Mahalanobis Distance variable that was created from the regression menu (Step 4 above). For X2, substitute the degrees of freedom – which corresponds to the number of variables being examined (in this case 3). By using this formula, we are calculating the p-value of the right-tail of the chi-square distribution. Click OK to compute the variable. This new variable will appear at the end of your spreadsheet.

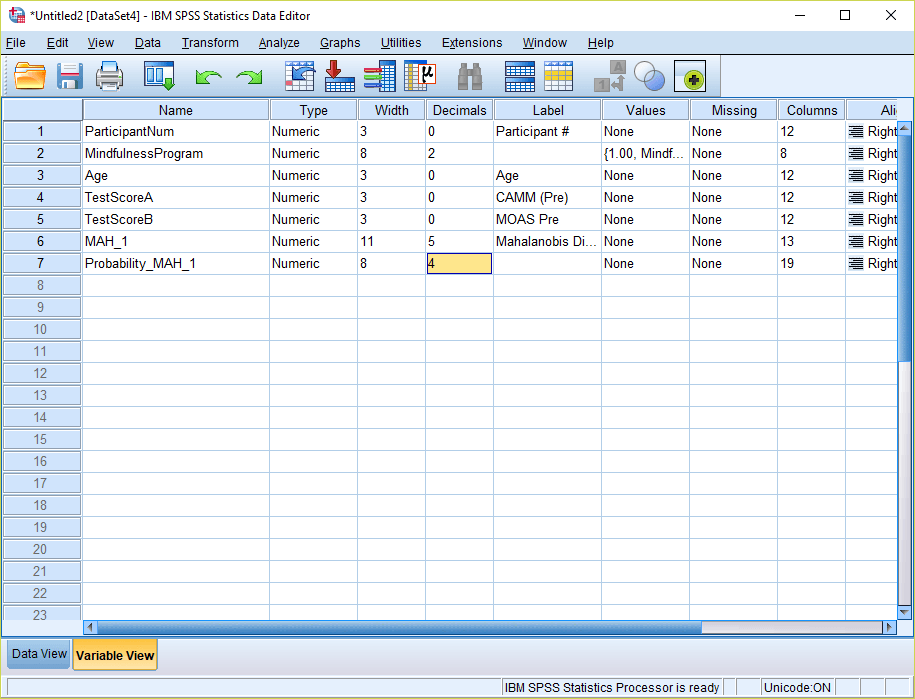
7) Go into Variable View and change the number of decimals for this new variable to “4.”
8) Now go back into Data View and examine the values. Multivariate outliers will be present wherever the values of the new probability variable are less than .001. In this case, there were three multivariate outliers. Prior to running inferential analyses, it would be advisable to remove these cases.