How to Set Up Pretest/Posttest Data for Your DNP Project
A common research design used by doctor of nursing practice (DNP) students is a simple pretest/posttest design. Say you want to implement an educational program in your nursing unit to see if it will increase nurses’ knowledge or competency. You might have a sample of nurses complete a pretest that assesses their current knowledge, and then have the nurses take the test again (i.e., a posttest) after they participate in your educational program. If the nurses perform better on the posttest compared to the pretest, you would have some evidence demonstrating the effectiveness of your program.
Setting Up Data for a Simple Pretest/Posttest Analysis
Although many DNP students use this approach, they often struggle when analyzing the data. An area of confusion for some students is how to set up the data properly. In this blog, we will demonstrate the correct way to set up data for a simple pretest/posttest analysis, with examples for two statistical software programs (SPSS and Intellectus Statistics). Note that these instructions apply only if you can match your pretest and posttest data (i.e., the same individuals took both tests, and you have identifiers to pair their responses). If you cannot match the data, follow a different procedure.
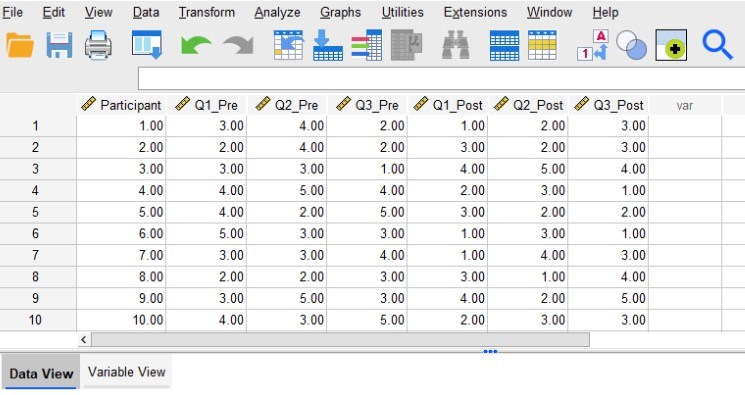
For this example, let’s say we have data from 10 participants. Each participant completed both a pretest and a posttest assessment. The assessment consisted of three questions (Q1, Q2, and Q3) that participants answered using a 1 to 5 Likert scale. Therefore, each participant has provided answers to three pretests questions and three posttest questions. The first image below shows what the data should look like in SPSS’s “Data View.”
Need help conducting your analysis? Leverage our 30+ years of experience and low-cost service to complete your results!
Schedule now using the calendar below.
Structuring Data for Pretest/Posttest Analysis
The first column labeled “Participant” contains the identification numbers for our 10 participants. Assigning participants an identification number (or having some other kind of identifier) allows us to match their pretest and posttest responses. The next three columns (Q1_Pre, Q2_Pre, and Q3_Pre) contain the participants’ pretest responses. Similarly, the last three columns (Q1_Post, Q2_Post, and Q3_Post) contain the participants’ posttest responses. Notice that underneath these column labels we have 10 rows of data corresponding to our 10 participants.
The data should be set up so that all of the data from each participant lines up in a single row. So, all of Participant 1’s answers are entered in row 1, all of Participant 2’s answers are entered in row 2, and so on. This is why having identification numbers is important, as they will help ensure that each participant’s pretest and posttest answers can be matched and entered into the same row.
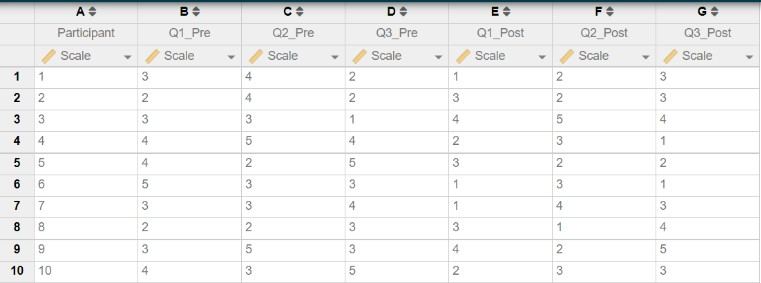
The next image below shows how the same data should look when entered in Intellectus Statistics. Notice how the structure of the data is the same as it was in SPSS. We have a column (A) containing the participant identification numbers, and columns (B-G) containing the data for each pretest and posttest question. We entered data for 10 participants in 10 rows, ensuring that all data from each participant appear in the same row.
Once you have the data set up this way, you may compute composite scores (if it is appropriate to do so with the instrument/assessment you are using) or begin running analyses (e.g., paired t-tests) to compare your pretest and posttest responses.

We work with graduate students every day and know what it takes to get your research approved.
- Address committee feedback
- Roadmap to completion
- Understand your needs and timeframe