How To Determine Sample Size From G*Power
Your Committee Won’t Approve a Sample Size You Can’t Justify. G*Power Is How You Justify It.
There’s a moment in every dissertation where your committee asks: “How did you arrive at this sample size?” If your answer is “I read that 100 is enough” or “My advisor said so,” you’re getting sent back. G*Power is the gold standard tool for a priori power analysis, but most students open it, stare at the interface, pick settings they don’t fully understand, and paste a number into their methodology chapter without really knowing what it means.
The tipping point isn’t the number. It’s the justification. A sample size of 128 means nothing if you can’t explain why it’s 128; which effect size you assumed, why you assumed it, what power level you targeted, and what happens to your study if you fall short.
Every unjustified sample size is a methodology chapter waiting to be rejected. G*Power takes five minutes to run correctly. That’s the tipping point between a proposal that moves forward and one that stalls.

Get Expert Help with Your Results. Schedule Your Free Consultation.
20 minutes with Dr. Lani. No obligation. No pressure.
Power, or the ability to detect an effect if there is one present, is an important tool used to reduce the chances of a type II error. Power can be thought of as sensitivity, meaning that the more power that is present, the more likely we are to be able to detect an effect if it is there.
There are a few aspects of a research study that can affect how much power an analysis will have. First of which is the alpha level, or the cutoff value for deeming significance. While the standard alpha for deeming significance is .05, lower alpha values will decrease the amount of power present which in turn can increase the chance of type II errors. Higher alpha levels, on the other hand, will increase power but in turn can increase the chance of a type I error. Another aspect of a research study that can affect power is the sample size. Larger sample sizes create artificial differences between participants, meaning that the more data that is collected, the greater power you will have.
Next, effect size, or how large of a difference is there, can affect power. This means that when there is a larger effect size, there is a greater difference between the groups. Therefore, power will be high. However, a small effect size will take more power to be able to detect an effect. Finally, the last aspect of a study that can impact power is the statistical test itself. Some tests have more sensitivity than others, and the simpler the test the more power there is to detect an effect.
In research, a power analysis is most often run prior to data collection so that the researcher can determine the minimum sample size needed to have enough power to detect an effect. This is commonly done through a software known as G*power.
G*power is a free statistical software that allows the user to determine statistical power based on a wide variety of tests. The user can specify the type of test being run, their desired level of power, and alpha level to determine the sample size needed. The rest of this blog will show each step to determine the sample size needed for a paired samples t-test.
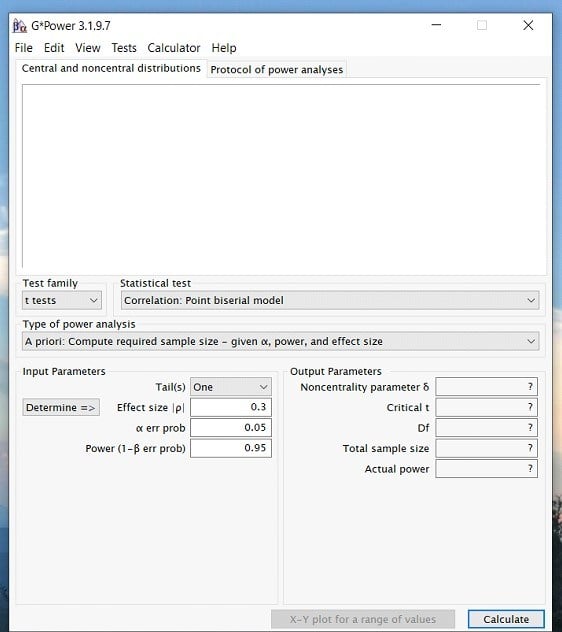
Step 1: Open G*power. Once you open the program, a popup window will appear that looks like this…
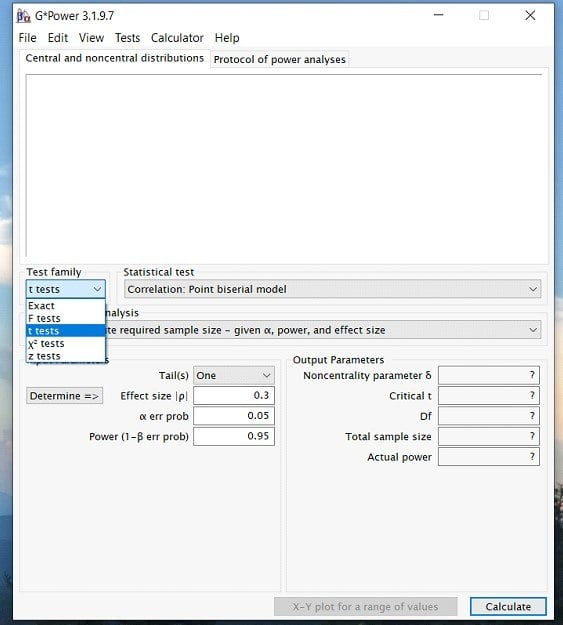
Step 2: Once you have opened the program. Click on the Test family drop down menu and select the type of statistic you are interested in. For a paired samples t-test, we will select the t-test option. However, if you are interested in an ANOVA or Regression then you would select the F test option.
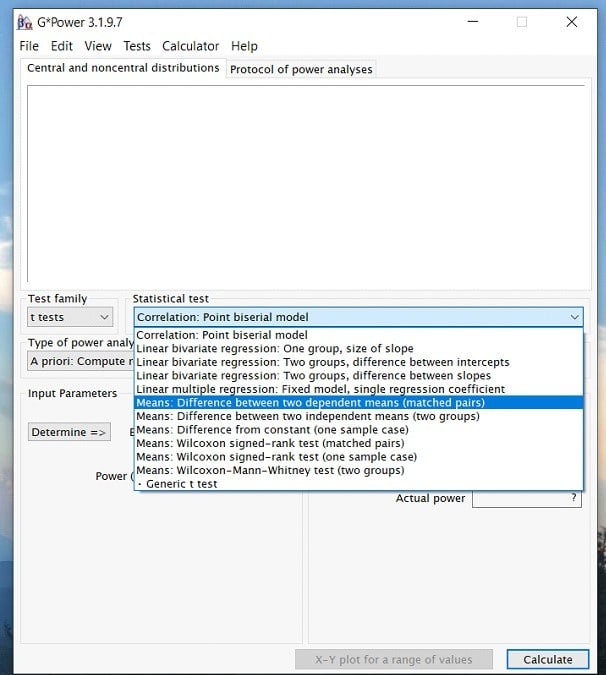
Step 3: Once you have determined the test family, you can click on the statistical test drop down menu and select the appropriate test for your analysis. In this case, we would choose the Means: Difference between two dependent means (matched pairs). Again, this is because we are running a paired samples t-test.
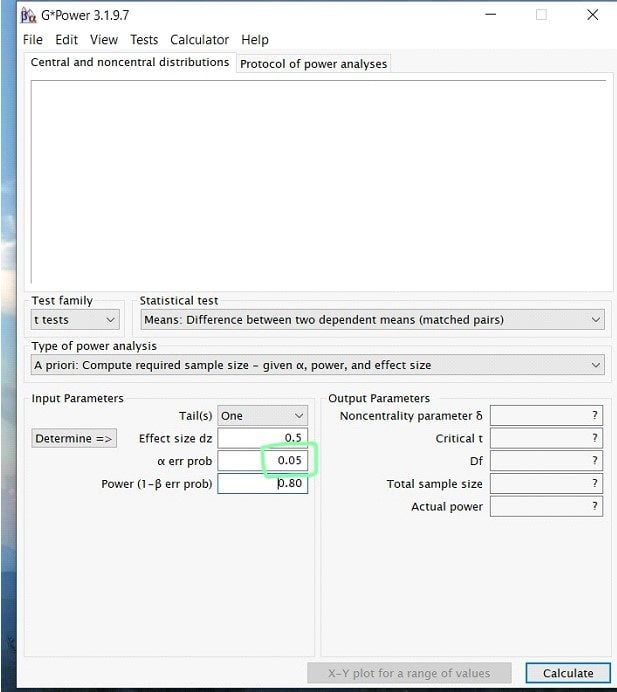
Step 4: Once you have selected your test, you will now be able to input the effect size, power, and alpha levels. (Note: depending on the test you may also have to know the group sizes, etc.)
Starting with effect size! What you put for your effect size is largely dependent on researcher discretion. This means that similar previous studies and literature should inform the researcher if a high, medium, or low effect size is appropriate. If you do not know the appropriate effect size, there is a determine button on g*power to help. Here, we decided to go with a medium effect size of .5.
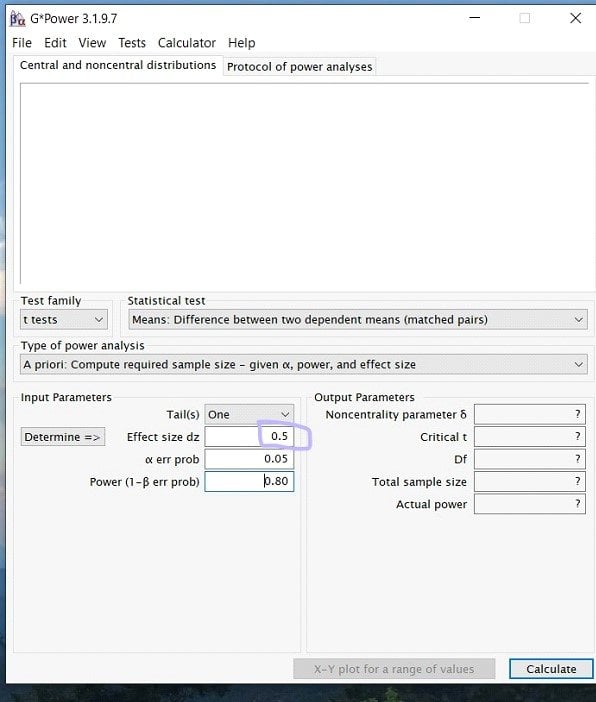
Step 5: Next to input the alpha level. For this, unless previous research has given you a reason to lower the value, it is a safe bet to always stay at alpha= .05.
Step 6: Finally, you will enter your desired power value. In most research studies, the widely accepted level of power is .80 or above. Therefore, unless previous literature prompts you to use a larger power, always use .80.
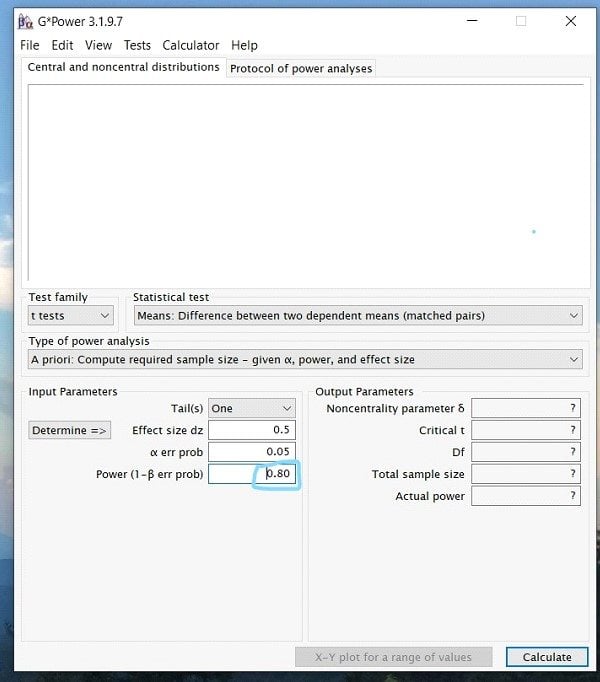
Step 7: Once you have inputted all the appropriate numbers, press calculate, and you should see a screen that looks like this …
While this looks like a lot of information, what is important when running a power analysis for the sample size is the Total Sample Size number under Output Parameters. In this case, for a paired sample t-test, the total sample size needed would be 27.
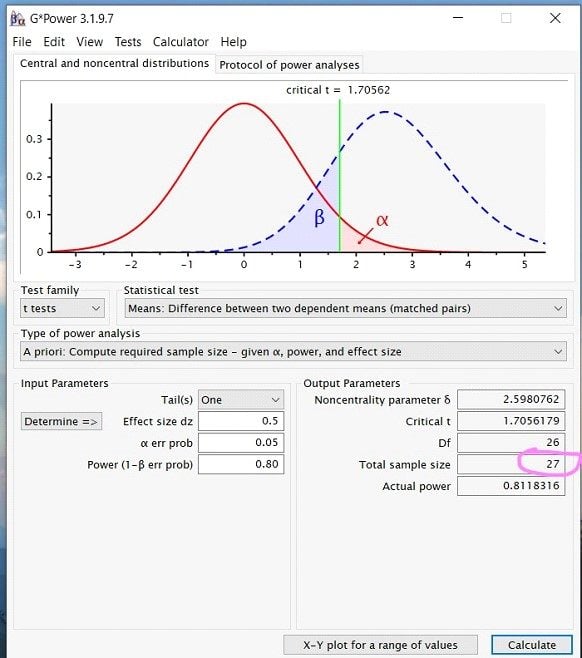
Finally, to report your power analysis, you would write up something along the lines of… A power analysis for a one-tailed paired-samples t-test indicated that the minimum sample size to yield a statistical power of at least .8 with an alpha of .05 and a medium effect size (d = 0.5) is 27.
Take the Course: Sample Size and Power Analysis

We work with graduate students every day and know what it takes to get your research approved.
- Address committee feedback
- Roadmap to completion
- Understand your needs and timeframe