Scatter Plot: An Assumption of Regression Analysis
What is the value in examining a scatter plot for a regression analysis?
Residual scatter plots provide a visual examination. The assumption homoscedasticity between the predicted dependent variable scores and the errors of prediction. The primary benefit is that the assumption could view and might analyze with one glance. Therefore, any violation determine quickly and easily. When an analysis meets the assumptions, the chances for making Type I and Type II errors might reduce. Also it improves the accuracy of the research findings.
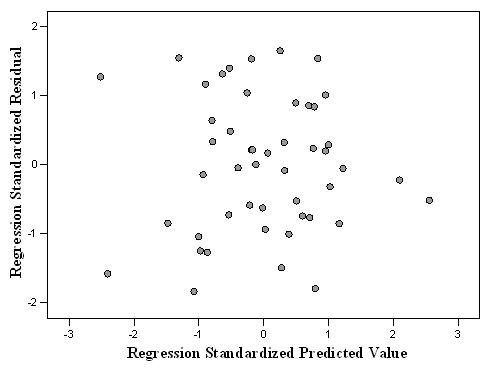
A residual scatter plot is a figure that shows one axis for predicted scores and one axis for errors of prediction. Initial visual examination can isolate any outliers, otherwise known as extreme scores, in the data-set. Tabachnick and Fidell (2007) explain the residuals (the difference between the obtained DV and the predicted DV scores) and the variance of the residuals should be the same for all predicted scores (homoscedasticity). If this is true, the assumption would meet and the scatter plot takes the (approximate) shape of a rectangular; scores will concentrate in the center (about the 0 point) and distributed in a rectangular pattern. More simply, scores will randomly scatter about a horizontal line. In contrast, any systematic pattern or clustering of scores could consider a violation.
The figure below shows a random displacement of scores that take on a rectangular shape with no clustering or systematic pattern. The figure shows the assumption of homoscedasticity is met.
*For assistance with regression or other quantitative analyses click here.
Reference
Tabachnick, B. G. & Fidell, L. S. (2007). Using multivariate statistics (5th ed.). Boston, MA: Allyn and Bacon. View![]()
Related Pages:
Need help conducting your Regression Analysis? Leverage our 30+ years of experience and low-cost same-day service to complete your results today!
Schedule now using the calendar below.