Data Management in SPSS
Conducting an analysis on your own can be a daunting task, especially if you are not familiar with the software you have to use to perform your analyses. There are many different programs you can use to analyze data; even Excel allows for some of the simpler analyses. Here we will discuss some data management tasks in a very commonly used data analysis software in doctoral research: the Statistical Package for the Social Sciences, or SPSS.
Data View and Variable View in SPSS
SPSS holds data in the same way as many other programs, with columns dedicated to different variables, and one observation (or participant) per row. This is the main way to view your data in SPSS, though you can also view just the list of variables in the dataset as well. These two data views have different uses; the variable view allows you to label categories, rename variables, and change each variable’s type, but does not allow you to see the data or edit any actual data entries.
Navigating Between Data View and Variable View in SPSS
The data viewer lets you see the data for each variable, but also just looks like a wall of numbers. Switching between the two views is as easy as double clicking on a variable’s number (in variable view) or a variable’s name (in data view), holding CTRL and pressing T, or selecting the view format from the tabs at the bottom of either window.
Need help conducting your analysis? Leverage our 30+ years of experience and low-cost service to complete your results!
Schedule now using the calendar below.
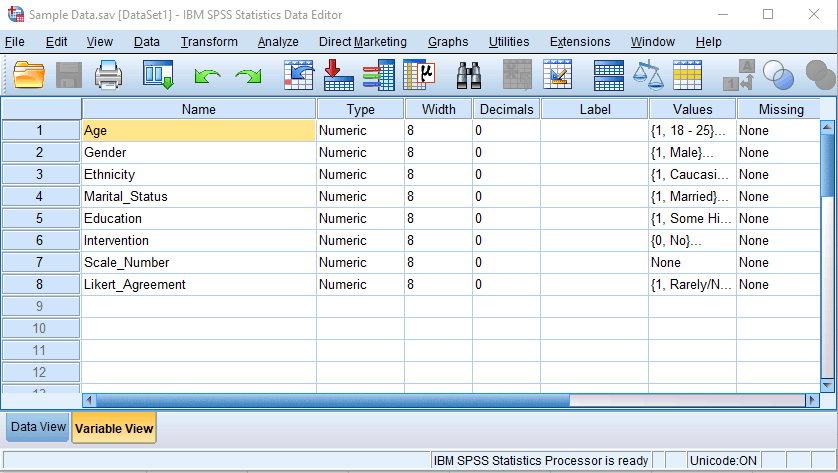
Here we will focus on the variable view. Naming the variables is usually the first step in creating your data set. You might skip this step if you have already downloaded your data with variable names included. You can rename the variable by double-clicking its name. In the sample below, all the variables are numeric, but you can click on the numeric label to change it as needed. Numeric is usually used, but some datasets may contain string variables, meaning the variable can hold non-numeric text. Text variable will not be available for most statistical analyses when you open your analysis windows. When you look at descriptive information or run your analyses, the number is automatically replaced with the label.
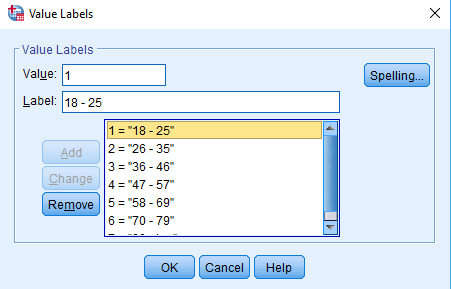
Clicking on the values in the value column allows you to assign labels to different numbers. For example, clicking on the age values brings up this window, where you can see that each number represents a range of ages (e.g., 1 = 18 – 25). When you look at descriptive information or run analyses, SPSS automatically replaces the number with the label. You can add new labels, or change or remove existing ones.
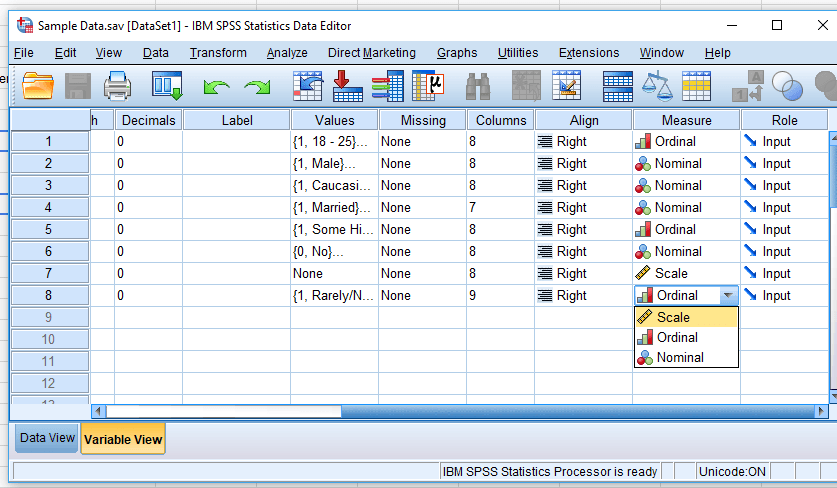
If you scroll over to the right side of the variable view window, you will also see the measure column. Ordinal data is typically used to identify Likert-type responses, where participants answer using a set of ordered categories. Scale variables, such as the number of times a participant has done a certain task, should be labeled as scale. Nominal variables, on the other hand, contain categories with no specific order, such as ethnicity or gender. You can change these with a simple drop-down.

Organizing a nice, clean dataset is the first step to getting your thoughts in order and makes interpreting your output much easier. If you ever need a second party to jump in to help you out, they will really appreciate that you have already taken a few moments to make all of your data clearly labeled and identified.