Data Cleaning and Management
Once the data collection process has completed, it is time to start cleaning your data so it is ready to run descriptive and inferential analyses. There are many statistical software packages that can be used for the data cleaning and management step. To illustrate the various steps of data management, SPSS will be utilized.
1) If using data collection programs like Survey Monkey or Qualtrics, data can be downloaded directly into SPSS format (.sav extension). You can also upload a spreadsheet from Excel format (.xls or .csv extensions) directly into SPSS.
2) Add an ID variable so every participant can be quickly identified with a number. Throughout the data analysis, you will be sorting your data in a different order. With this ID column you can revert back to the original order by sorting the ID in ascending order. This is a good way to keep track of participants if you are making removals for partial responses or outliers.
3) Name every variable that will be used in the spreadsheet. Use Excel to quickly autofill variables with ascending numbers (ex: jobsatisfaction1, jobsatisfaction2, jobsatisfaction3, etc). Try to use a short and concise phrase (with no spaces) so you can easily identify what the items are measuring.
4) Save your spreadsheet after every major adjustment (recoding or removing cases).
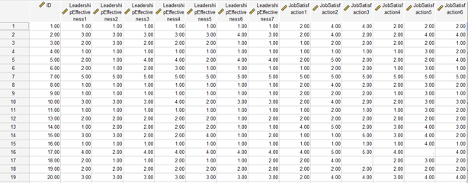
Note the screenshot below in which an ID column has been added in ascending order. The variables of interest have been renamed to short phrases with sequential numbers.
Next, you want to recode ordinal or Likert-scale data from string format (words) to numeric format. You will also want to review the scoring instructions for the surveys to identify if reverse scoring is necessary. Reverse scoring is typically necessary if there are combinations of positively phrased and negatively phrased items. Most scoring guides will identify where to reverse score. Both steps can be performed under the Transform menu in SPSS. There are two options to use: “Recode into Same Variables” or “Recode into Different Variables”. I tend to use the “Recode into Different Variables” option because it can be beneficial to keep the original variables in the spreadsheet, while adding the new recoded variables. You may need the original coding if a committee member is reviewing the data and wants to see the variables in their raw (original) format.
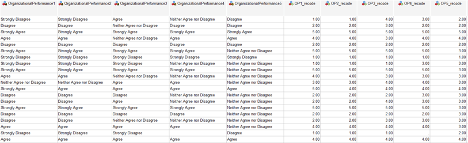
Note in the screenshot below, all five “organizational performance” items are in string format – which essentially means letters and words. We need to assign numeric meaning to the Likert-scale by converting the words to numbers using the “Recode into Different Variables” option. The first five items in the screenshot represent the original coding of string-format responses, and the last five items (OP1_recode to OP5_recode) represent the recoding to numeric format. The recode has changed the variables from Strongly Disagree to 1, Disagree to 2, Neither Agree nor Disagree to 3, Agree to 4, and Strongly Agree to 5. Side-by-side, we can see the original variables and the recodes.
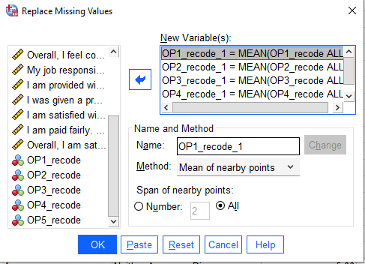
The next step of the data cleaning process is to handle missing data. There are many ways to deal with missing responses. If your sample size is far above your minimum requirement (as calculated with a power analysis), then it may be acceptable to remove participants that did not complete the survey. Some statisticians argue for predictive techniques such as imputation. Other statisticians support the use of mean or median replacement. Check with your committee if they have a preference for missing data replacement methods. Under the Transform menu, we can use the “Replace Missing Values” option to substitute the missing scores with means (averages) or medians.
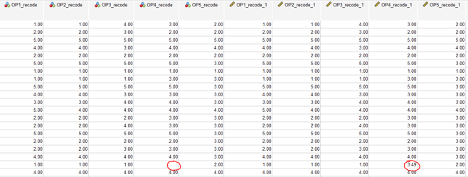
Note how in the screenshot below, the missing value in OP4_recode has now been replaced with the mean (3.49) in a newly created variable OP4_recode_1. The “replaced missing values” variables will all have a “_1” following the original variable name.
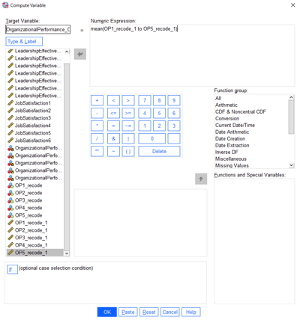
The next step is creating composite scores for the variables of interest. This step may require searching the internet for scoring instructions on the particular survey that was administered. Most of the time, an average or a sum is computed from the series of Likert-scale items. In some cases, each survey item will need to be examined independently as opposed to creating a composite score. To generate composite scores, use the Transform -> Compute Variable command in SPSS. To illustrate with an example, the Organizational Performance variable for this study was computed through an average of the five items comprising the survey. First, we need to give the composite variable a name such as OrganizationalPerformance_Overall. Then, we need to identify that a mean is being computed of the five items. Running this code generates a new variable which will represent overall organizational performance.
After the data have been cleaned to account for string variables, missing responses, and generation of composite scores – the data are essentially ready for analysis. The next step is analyzing the data. Keep in mind that depending on the inferential analyses that were proposed (regression, t-tests, ANOVAs, etc), there are specific statistical assumptions that should be verified such as removal of outliers, normality, homogeneity of variance, etc. There are numerous ways to verify that these assumptions are supported. Please review our other blogs and webinars in which assumption testing is discussed.

We work with graduate students every day and know what it takes to get your research approved.
- Address committee feedback
- Roadmap to completion
- Understand your needs and timeframe