Archival Data: Finding an Appropriate Dataset
When conducting a quantitative dissertation study, you may have the option of recruiting participants and collecting data yourself (i.e., primary data) or analyzing a dataset that has already been collected by another researcher (i.e., archival data). A common perception among students is that using archival data is easier than collecting primary data. Although it is true that using archival data means that you do not have to worry about recruiting participants, you still have to find an existing dataset that contains the variables and population of interest for your study. Sometimes this can be just as difficult as getting a suitable group of people to fill out a survey. In fact, students often have a hard time determining what is analyzable data and what is not. Here we will discuss what to look for when searching for an appropriate archival dataset.

Discover How We Assist to Edit Your Dissertation Chapters
Aligning theoretical framework, gathering articles, synthesizing gaps, articulating a clear methodology and data plan, and writing about the theoretical and practical implications of your research are part of our comprehensive dissertation editing services.
- Bring dissertation editing expertise to chapters 1-5 in timely manner.
- Track all changes, then work with you to bring about scholarly writing.
- Ongoing support to address committee feedback, reducing revisions.
First, you need to identify a single dataset that was collected from your population of interest and contains all of your variables of interest. It is often impossible or (at best) extremely difficult to combine data from multiple different datasets for a single analysis. Unless the exact same cases (e.g., individual persons) are present in all the datasets and they have some kind of identifier (such as an ID number) to link the datasets together, all of the data must come from one source.
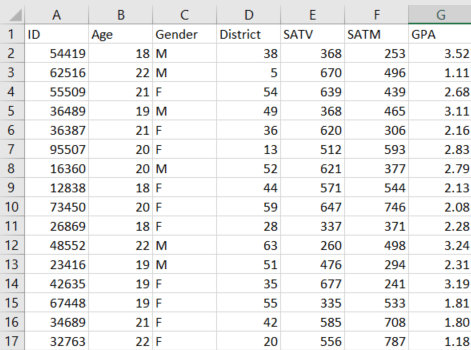
Once you find something that has the correct variables and population, you need to determine if what you found is actually a dataset, and not simply a data report or a research article. A proper dataset will most often be delivered in the form of an electronic spreadsheet file (such as .xlsx or .csv). In the spreadsheet file, the variables should be listed in columns and the cases (e.g., individual people) should be listed in rows. The image below is an example of what a dataset looks like.

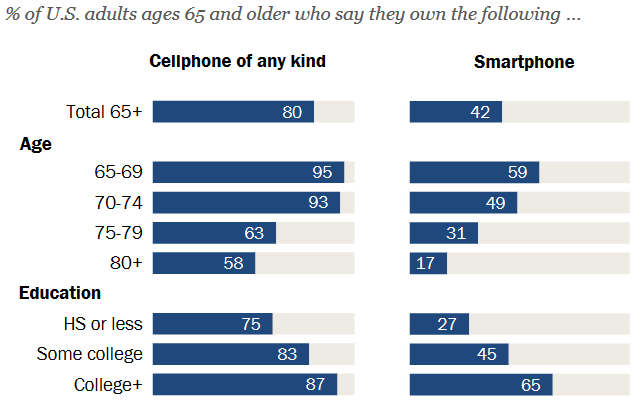
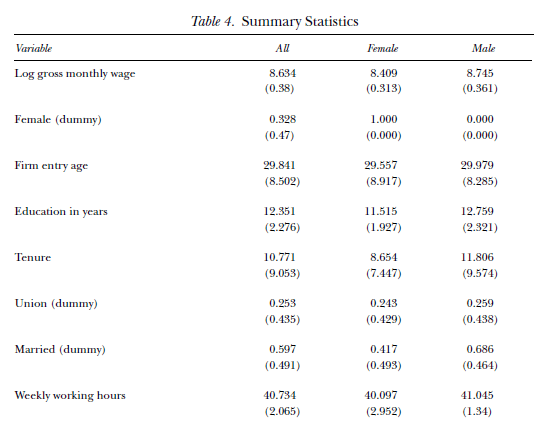
Do not confuse a dataset with a data report. A data report only displays aggregate statistics (such as means, standard deviations, or percentages) rather than individual points of data. Similarly, a journal article only presents the results of data analyses and does not contain the actual data. These are often found as .pdf files, so if you downloaded a .pdf from an internet source, chances are it is not a dataset. The images below are examples of what you would see in a data report or journal article, but these things are NOT datasets.


