Using SPSS Syntax
The Statistical Package for the Social Sciences (SPSS) is one of the most frequently used statistical software packages. It is used to manage data, clean data, and run complex statistical analyses. SPSS is convenient due to its use of the point-and-click technique, meaning that intuitive point-and-click menus are used to select various statistical commands. Often times, however, there is an even more efficient route than the point-and-click method: the SPSS syntax editor. The syntax editor allows you to quickly replicate statistical functions. For example, in the screenshot below, the “transform” function is being used to calculate a mean composite score for Satisfaction.

Discover How We Assist to Edit Your Dissertation Chapters
Aligning theoretical framework, gathering articles, synthesizing gaps, articulating a clear methodology and data plan, and writing about the theoretical and practical implications of your research are part of our comprehensive dissertation editing services.
- Bring dissertation editing expertise to chapters 1-5 in timely manner.
- Track all changes, then work with you to bring about scholarly writing.
- Ongoing support to address committee feedback, reducing revisions.
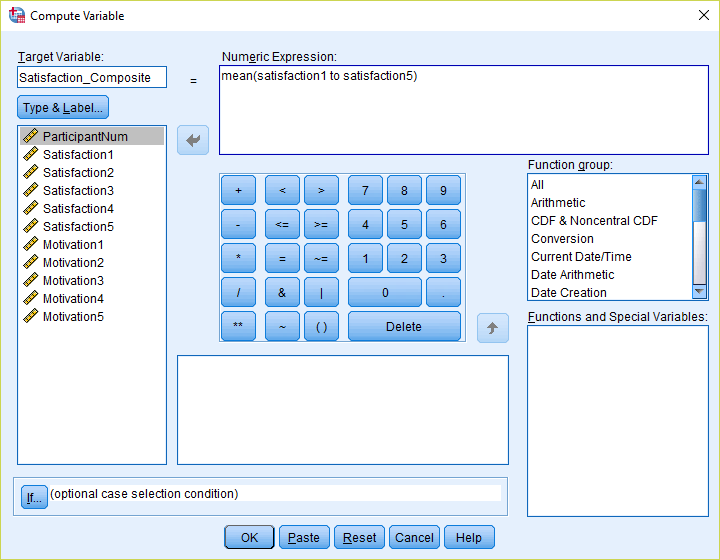
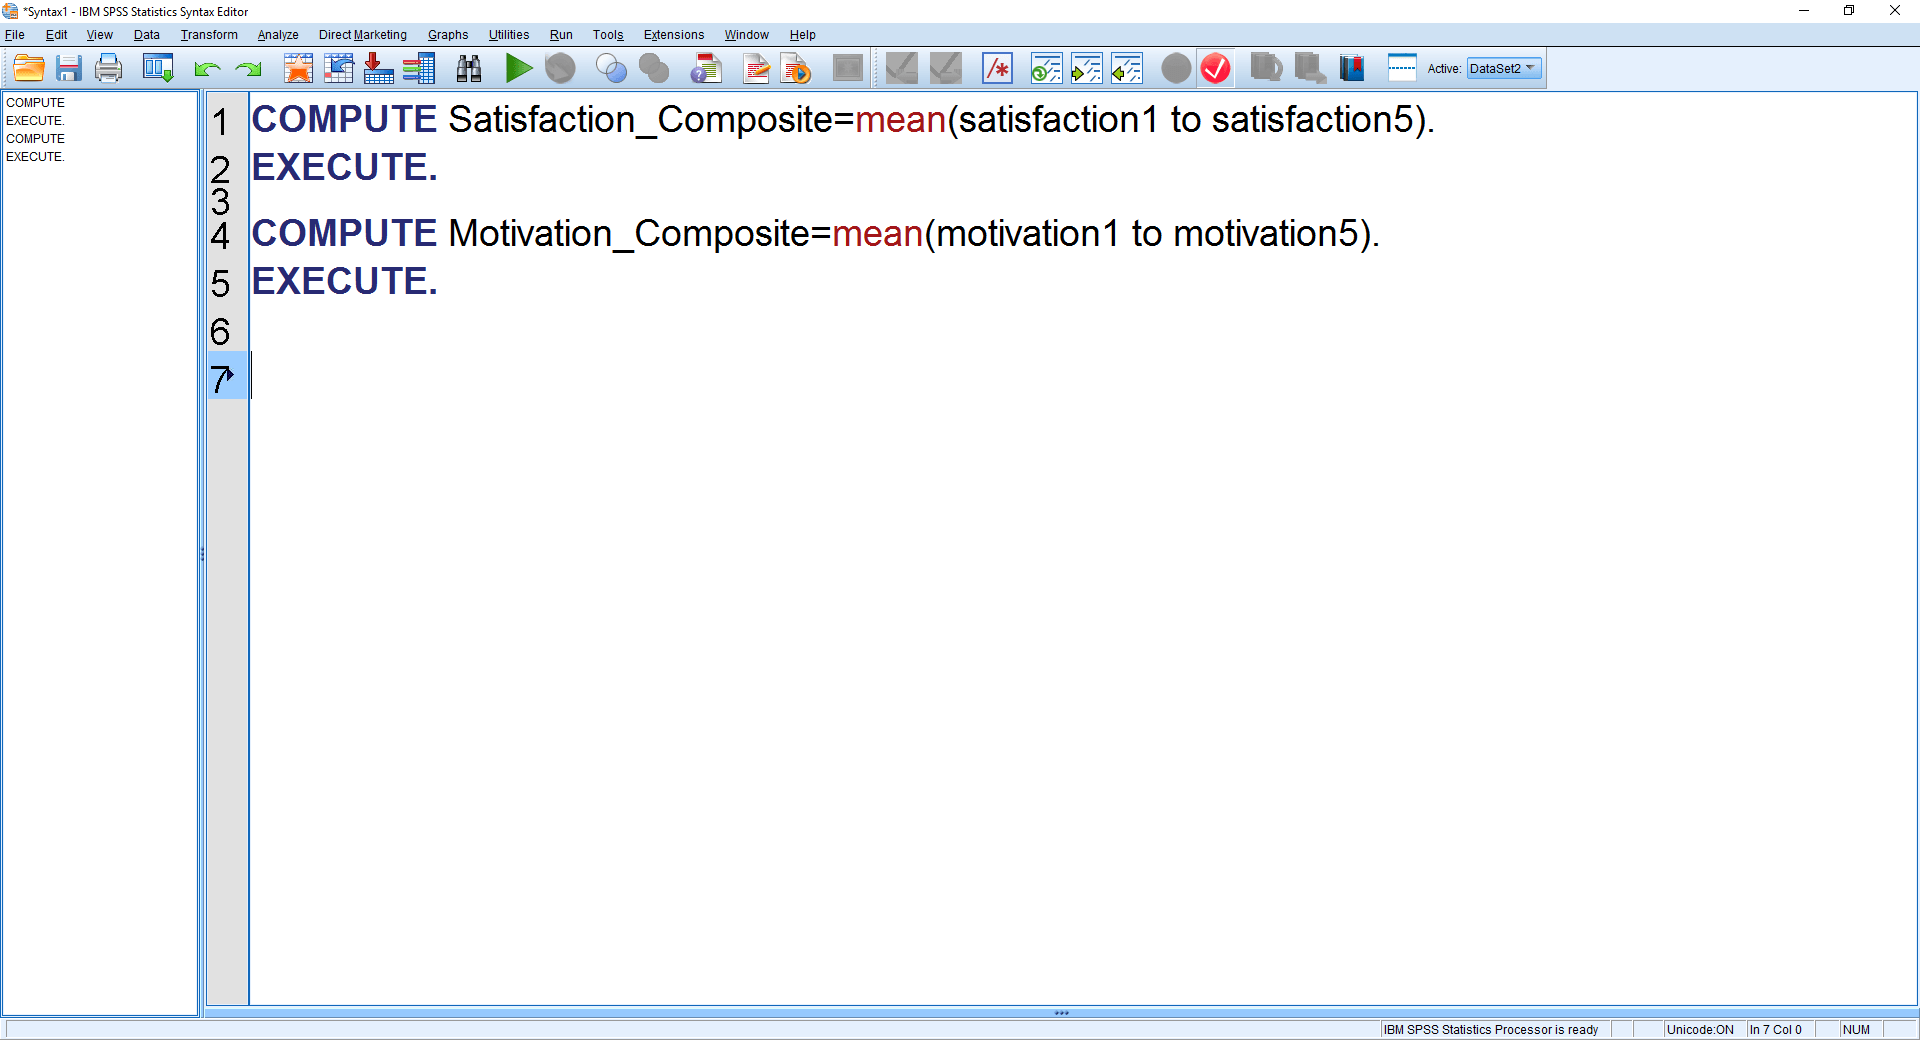
If you click “Paste” within the above window, the syntax for this command will be presented. Instead of going back into the transform menu, you can quickly copy, replace, and rephrase syntax to replicate a similar procedure – as done with the motivation construct below.
This procedure can be extended to use for almost all statistical analyses and can be useful if repeating statistical functions while substituting only a few variables. For example, if you plan to run several regressions or ANOVAs but are only swapping a few variables of interest, the syntax editor can be used to quickly generate code for the analysis.

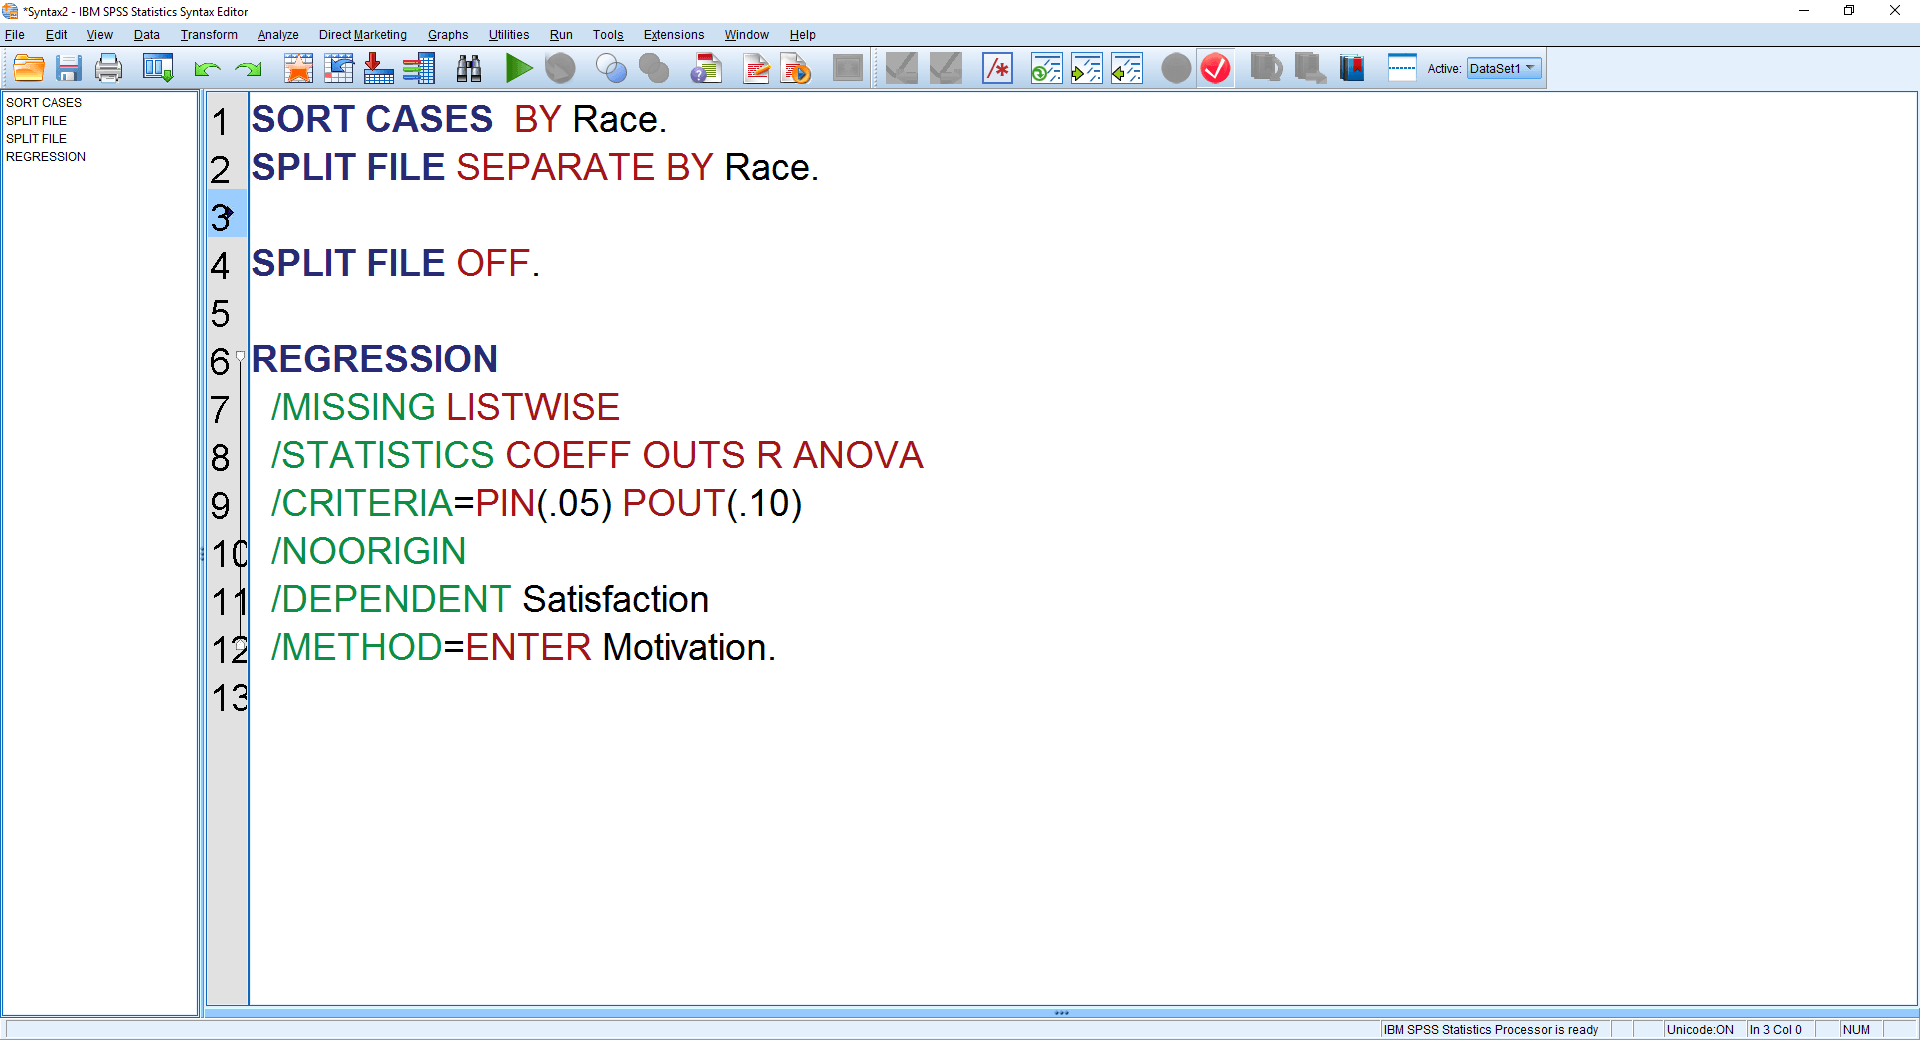
One of the most useful examples I have found for the syntax editor is in relation to the “split file” function. The split file function allows you to partition and perform statistical analysis for the individual groups of a categorical variable. As presented in the screenshot below, if you wanted to run a separate regression for three different race groups (e.g., White, Black, and Asian), you could highlight and run the code “SORT CASES BY Race” and “SPLIT FILE SEPARTE BY Race”, then run the regression syntax. This will generate three separate regressions for all three races. If you want to turn off the split function, then simply highlight and run “SPLIT FILE OFF”. The split file function will be turned off allowing you to run subsequent analyses with all race groups combined.