Using Chi-Square Statistic in Research
Understanding the Chi-Square Test: A Simple Guide
What’s the Chi-Square Test For? The Chi-Square test helps us figure out if two things we’re interested in (like voter intent and political party membership) are related or just a coincidence. In technical terms, it tests if there’s a significant relationship between two categorical variables—things you can put into categories, like types of fruit or movie genres.
Starting Point: The Null Hypothesis The test starts with a basic assumption called the null hypothesis, which suggests that there’s no connection between the variables in the larger population. They’re independent. For example, it would assume that voter intent doesn’t depend on political party membership.
How Does It Work? Imagine you have a big table (called a crosstabulation or bivariate table) that shows how different categories, like voter intent and political party, overlap. Each cell in the table shows the count of how many people or things fall into each combined category.
The Chi-Square test looks at the numbers in this table in two steps:
Expected vs. Observed: First, it calculates what the numbers in each cell of the table would be if there were no relationship between the variables—these are the expected counts. Then, it compares these expected counts to the actual counts (observed) in your data.
The Chi-Square Statistic: Using these comparisons, it calculates a number (the Chi-Square statistic). If this number is big enough (based on a critical value from the Chi-Square distribution), it suggests that the observed counts are too different from the expected counts to be just a coincidence. This means there’s likely a significant relationship between the variables.
Example Question
“Is there a significant relationship between voter intent and political party membership?”
Using the Chi-Square test, we can analyze data from surveys or polls to see if voter intent really varies by political party, or if any patterns we see could just be random.
Key Takeaways
The Chi-Square test is a handy tool for exploring relationships between categorical variables. By comparing what we observe in the real world to what we would expect if there were no relationship, it helps us understand if our variables are truly independent or if there’s something more going on.
Need help with your research?
Schedule a time to speak with an expert using the calendar below.
User-friendly Software
Transform raw data to written, interpreted, APA formatted Chi-Square results in seconds.
The calculation of the Chi-Square statistic is quite straight-forward and intuitive:
where fo = the observed frequency (the observed counts in the cells)
and fe = the expected frequency if NO relationship existed between the variables
As depicted in the formula, the Chi-Square statistic is based on the difference between what is actually observed in the data and what would be expected if there was truly no relationship between the variables.
How is the Chi-Square statistic run in SPSS and how is the output interpreted?
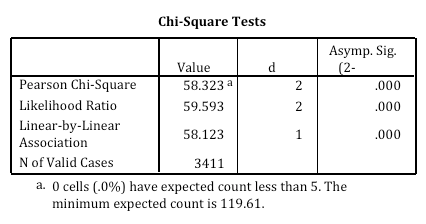
The Chi-Square statistic appears as an option when requesting a crosstabulation in SPSS. The output is labeled Chi-Square Tests; the Chi-Square statistic used in the Test of Independence is labeled Pearson Chi-Square. This statistic can be evaluated by comparing the actual value against a critical value found in a Chi-Square distribution (where degrees of freedom is calculated as # of rows – 1 x # of columns – 1), but it is easier to simply examine the p-value provided by SPSS. To make a conclusion about the hypothesis with 95% confidence, the value labeled Asymp. Sig. (which is the p-value of the Chi-Square statistic) should be less than .05 (which is the alpha level associated with a 95% confidence level).
Is the p-value (labeled Asymp. Sig.) less than .05? If so, we can conclude that the variables are not independent of each other and that there is a statistical relationship between the categorical variables.
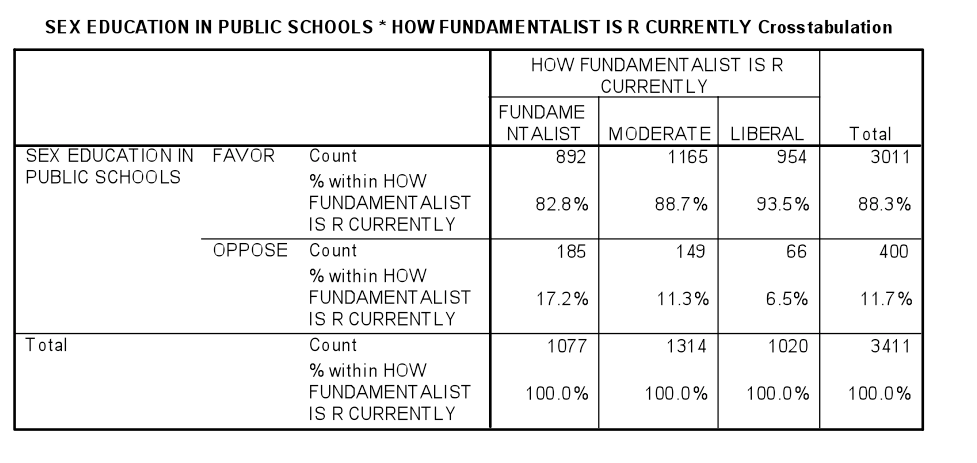
In this example, there is an association between fundamentalism and views on teaching sex education in public schools. While 17.2% of fundamentalists oppose teaching sex education, only 6.5% of liberals are opposed. The p-value indicates that these variables are not independent of each other and that there is a statistically significant relationship between the categorical variables.
What are special concerns with regard to the Chi-Square statistic?
There are a number of important considerations when using the Chi-Square statistic to evaluate a crosstabulation. Because of how the Chi-Square value is calculated, it is extremely sensitive to sample size – when the sample size is too large (~500), almost any small difference will appear statistically significant. It is also sensitive to the distribution within the cells, and SPSS gives a warning message if cells have fewer than 5 cases. This can be addressed by always using categorical variables with a limited number of categories (e.g., by combining categories if necessary to produce a smaller table).
Statistics Solutions can assist with your quantitative analysis by assisting you to develop your methodology and results chapters. The services that we offer include:
Quantitative Results Section (Descriptive Statistics, Bivariate and Multivariate Analyses, Structural Equation Modeling, Path analysis, HLM, Cluster Analysis)
Please call 727-442-4290 to request a quote based on the specifics of your research, schedule a consultation here, or email [email protected]


