Effect Size
Effect size is a statistical concept that measures the strength of the relationship between two variables on a numeric scale. For instance, if we collect data on the height of men and women and observe that, on average, men are taller, we define the difference in height as the effect size. The greater the effect size, the greater the height difference between men and women will be.
Statistic effect size helps us in determining if the difference is real or if it is due to a change of factors. Effect size, power, sample size, and critical significance level are interconnected in hypothesis testing. In meta-analysis, researchers focus on the effect size across different studies and combine them into a single analysis. Statistical analysis typically measures effect size in three ways: (1) standardized mean difference, (2) odds ratio, and (3) correlation coefficient.
Types of effect size
Pearson r correlation: Karl Pearson developed the Pearson r correlation. Researchers use it as the most widely used correlation in statistics. One can denote this effect size parameter by r. The value of the effect size of Pearson r correlation varies between -1 to +1. According to Cohen (1988, 1992), the effect size is low if the value of r varies around 0.1, medium if r varies around 0.3, and large if r varies more than 0.5. Researchers compute the Pearson correlation using the following formula:
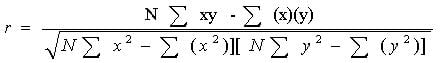
Where
r = correlation coefficient
N = number of pairs of scores
∑xy = sum of the products of paired scores
∑x = sum of x scores
∑y = sum of y scores
∑x2= sum of squared x scores
∑y2= sum of squared y scores
Need help conducting your analysis? Leverage our 30+ years of experience and low-cost same-day service to complete your results today!
Schedule now using the calendar below.
Standardized means difference:
When researchers base a study on the population mean and standard deviation, they use the following method to understand the concept:
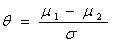
One can determine the effect size of the population by dividing the difference between the two population means by their standard deviation.
Cohen’s d Cohen’s d represents the difference between two population means, divided by the standard deviation of the data. Mathematically, they denote Cohen’s d as:
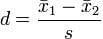
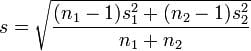
Where s can be calculated using this formula:
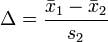
Glass’s Δ method: This method is similar to Cohen’s method, but it uses the standard deviation of the second group. Mathematically, we express this formula as:
Hedges’ g method: This method is the modified method of Cohen’s d method. We can express Hedges’ g method of this concept mathematically as follows:
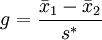
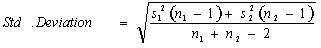
Where standard deviation can be calculated using this formula:
Cohen’s f2 method: Cohen’s f2 method measures it when we use methods like ANOVA, multiple regression, etc. The Cohen’s f² measure for multiple regressions defines the following:
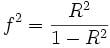
Where R2 is the squared multiple correlation.
Cramer’s φ or Cramer’s V method: Chi-square is the best statistic to measure it for nominal data. In nominal data, when a variable has two categories, then Cramer’s phi is the best statistic use. When these categories are more than two, then Cramer’s V statistics will give the best result for nominal data.
Odd ratio: The odds ratio is the odds of success in the treatment group relative to the odds of success in the control group. This method is used in cases when data is binary. For example, it is used if we have the following table:
| Frequency | ||
| Success | Failure | |
| Treatment group | a | b |
| Control group | c | d |
To measure the effect size of the table, we can use the following odd ratio formula:![]()
Related Pages:
To reference this page: Statistics Solutions. (2013). Effect Size . Retrieved from https://www.statisticssolutions.com/academic-solutions/resources/directory-of-statistical-analyses/effect-size/