Conduct and Interpret a One-Way ANCOVA
ANCOVA, or Analysis of Covariance, is a statistical tool that blends elements of ANOVA (Analysis of Variance) and regression analysis. It’s designed to understand how an independent variable affects a dependent variable, while also accounting for other variables (covariates) that might influence the outcome.
Here’s a simplified breakdown:
- Adjust for Other Factors: ANCOVA starts by adjusting the dependent variable for the effects of covariates. This is like correcting for factors that might skew the results, ensuring you’re comparing apples to apples.
- Analyze the Core Relationship: After adjusting for these covariates, ANCOVA then examines whether the independent variable (the main factor you’re interested in) truly has an effect on the dependent variable (the outcome).
- Enhance Analysis Power: By accounting for covariates, ANCOVA helps clarify the specific impact of the independent variable on the outcome. This makes your analysis more precise and powerful, as it explains more of the variance in your data than ANOVA alone.
In essence, ANCOVA is a more refined way to analyze data, ensuring that the conclusions drawn about the relationship between variables are as accurate as possible by removing the noise of external factors.
ANCOVA help?
Option 1: User-friendly Software
Transform raw data to written interpreted results in seconds.
Option 2: Professional Statistician
Collaborate with a statistician to complete and understand your results.
Understanding ANCOVA Simply
What’s ANCOVA? ANCOVA stands for Analysis of Covariance. It’s like a supercharged version of ANOVA (Analysis of Variance), mixed with some regression analysis. Imagine you’re trying to see if a new teaching method helps students score better on tests. ANCOVA helps you look at those test scores while also considering other things that might affect them, like how much students studied or their previous grades.
Why Be Careful with Too Many Covariates? Think of covariates like ingredients in a recipe. Just the right amount can make your analysis perfect, but too many might spoil it. If you add too many covariates (extra factors you’re considering), you might make your analysis too specific to be useful for broader questions. It’s like fitting a key so precisely to one lock that it can’t open anything else.
The Basics of One-Way ANCOVA: One-Way ANCOVA is a tool that helps you compare groups (like different classrooms) while considering other factors (like previous test scores).
- Independent Variable: This is what divides your groups (e.g., different teaching methods). It’s categorical, meaning it’s about types, not numbers.
- Dependent Variable: This is what you’re measuring (e.g., test scores). It needs to be a continuous number (like percentages or scores).
- Covariate: This is an extra factor you’re considering that might affect the dependent variable (e.g., hours of study). It also needs to be a continuous number.
What Can ANCOVA Answer?
- In Medicine: Can a new drug extend life expectancy? ANCOVA can compare drug effects while considering factors like age or lifestyle.
- In Sociology: Are wealthier people happier? ANCOVA can explore this by also looking at factors like marital status or job satisfaction.
- In Management Studies: What strategies make companies more profitable? ANCOVA can help figure this out by also considering company size or market trends.
Using ANCOVA in SPSS: SPSS, a software for statistical analysis, includes One-Way ANCOVA in its General Linear Models section. It lets you add up to 10 covariates to your analysis, helping you get a clearer picture of what’s affecting your dependent variable. Just remember, the way you set up your data in SPSS matters to get accurate results.
Key Takeaways
ANCOVA is a powerful tool for understanding how different factors affect outcomes, but it’s important to use it wisely. Too many covariates can complicate your analysis, so focus on what really matters. Whether you’re studying the effectiveness of a drug, the happiness across income levels, or the best strategies for business success, ANCOVA can provide deeper insights by considering the bigger picture.
Note that just like in regression analysis and all linear models, over-fitting might occur. That is, the more covariates you enter into the ANCOVA,
The research question for this example is as follows:
Is there a difference in the standardized math test scores between students who passed the exam and students who failed the exam, when we control for reading abilities?
The One-Way ANCOVA can be found in Analyze/General Linear Model/Univariate…
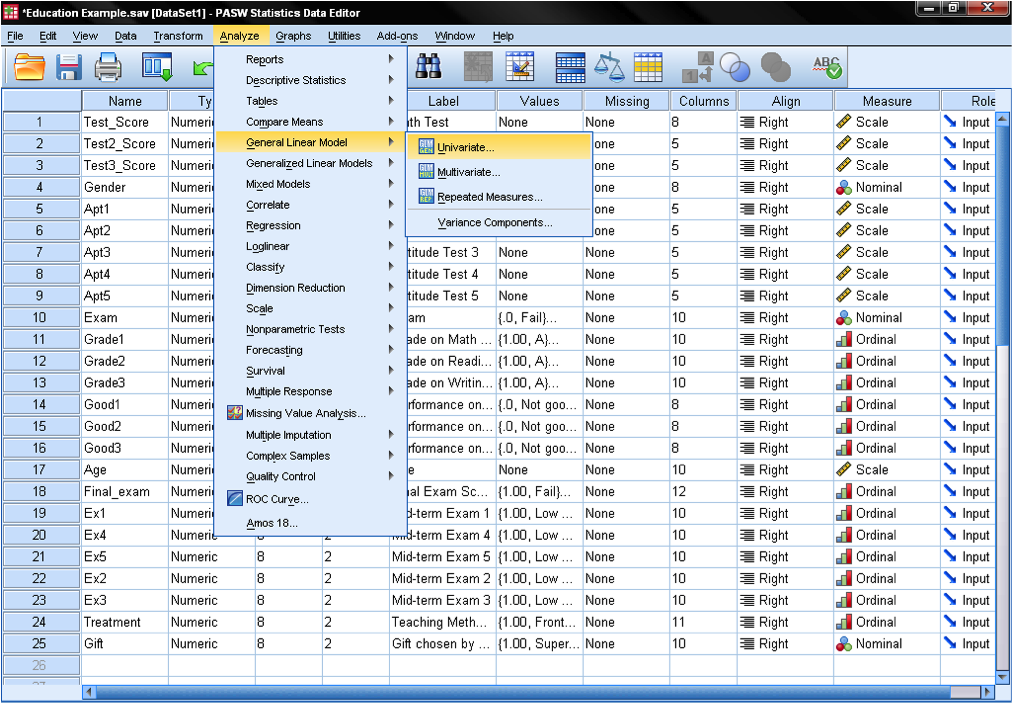
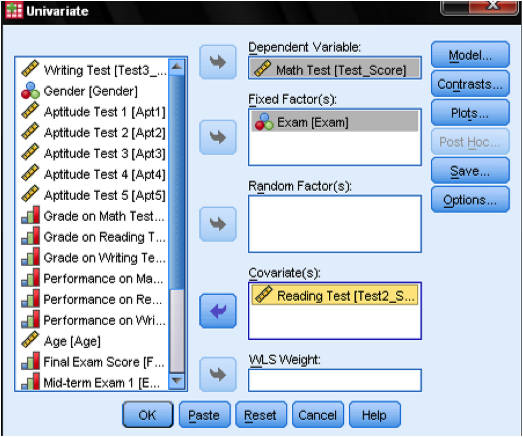
This opens the GLM dialog, which allows us to specify any linear model. For a One-Way-ANCOVA we need to add the independent variable (the factor Exam) to the list of fixed factors. [Remember that the factor is fixed, if it is deliberately manipulated and not just randomly drawn from a population. In our ANCOVA example this is the case. This also makes the ANCOVA the model of choice when analyzing semi-partial correlations in an experiment, instead of the partial correlation analysis which requires random data.]
The Dependent Variable is the Students’ math test score, and the covariate is the reading score.
In the dialog boxes Model, Contrasts, and Plots we leave all settings on the default. The field post hocs is disabled when one or more covariates are entered into the analysis. If it is of interest, for the factor level that has the biggest influence a contrast can be added to the analysis. If we want to compare all groups against a specific group, we need to select Simple as the contrast method. We also need to specify if the first or last group should be the group to which all other groups are compared. For our example we want to compare all groups against the classroom lecture, thus we add the contrast Exam (Simple) first.
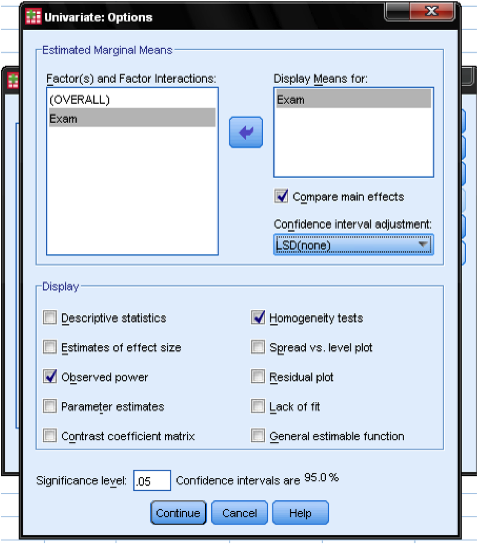
In the dialog Options… we can specify whether to display additional statistics (e.g., descriptive statistics, parameter estimates, and homogeneity tests), and which level of significance we need. This dialog also allows us to add post hoc procedures to the one-way ANCOVA. We can choose between Bonferroni, LSD and Sidak adjustments for multiple comparisons of the covariates.