Conduct and Interpret a Factorial ANOVA
What is the Factorial ANOVA?
Factorial ANOVA stands for Factorial Analysis of Variance. It’s a step beyond the one-way ANOVA, which you might recall is used to check if there are significant differences between two or more groups based on one characteristic. Factorial ANOVA, on the other hand, allows us to compare groups based on two or more independent variables. This means we’re not just looking at one factor to divide our sample into groups but multiple factors, leading to a more detailed analysis.
In the simplest form of factorial ANOVA, we might use two factors (each being binary, meaning they have two levels), which gives us four distinct groups to compare. For example, if we’re studying the effect of study method (visual vs. auditory) and test timing (morning vs. evening) on test scores, we’d have four groups: visual-morning, visual-evening, auditory-morning, and auditory-evening.
Factorial ANOVA doesn’t just tell us if there are differences between these groups; it also explores the interaction between factors. This means it looks at whether the impact of one factor depends on the level of the other factor. For instance, maybe the visual method works better in the morning, but the auditory method works better in the evening.
Some researchers use factorial ANOVA to delve into cause-and-effect relationships. They suggest that the independent variables (or factors) we control and manipulate can cause significant differences in the outcomes we’re measuring. By organizing our data points into groups based on these factors, we can see how the average outcomes (means) differ between the groups.
In summary, factorial ANOVA is a powerful tool for analyzing how multiple factors influence outcomes and how these factors interact with each other. It gives us a more nuanced understanding of the data by allowing us to compare multiple groups formed by two or more variables, offering insights into complex relationships within our data.
ANOVA help?
Option 1: User-friendly Software
Transform raw data to written interpreted results in seconds.
Option 2: Professional Statistician
Collaborate with a statistician to complete and understand your results.
| Independent Variables | |||
| 1 | 2+ | ||
| Dependent Variables | 1 | One-way ANOVA | Factorial ANOVA |
| 2+ | Multiple ANOVAs | MANOVA |
Example: Let us claim that blonde women have on average longer hair than brunette women as well as men of all hair colors. We find 100 undergraduate students and measure the length of their hair. A conservative statistician would then state that we measured the hair of 50 female (25 blondes, 25 brunettes) and 25 male students, and we conducted an analysis of variance and found that the average hair of blonde female undergraduate students was significantly longer than the hair of their fellow students. A more aggressive statistician would claim that gender and hair color have a direct influence on the length of a person’s hair.
Most statisticians fall into the second category. It is generally assumed that the factorial ANOVA is an ‘analysis of dependencies.’It is referred to as such because it tests to prove an assumed cause-effect relationship between the two or more independent variables and the dependent variables. In more statistical terms it tests the effect of one or more independent variables on one dependent variable. It assumes an effect of Y = f(x1, x2, x3, … xn).
The factorial ANOVA is closely related to both the one-way ANOVA (which we already discussed) and the MANOVA (Multivariate Analysis of Variance). Whereas the factorial ANOVAs can have one or more independent variables, the one-way ANOVA always has only one dependent variable. On the other hand, the MANOVA can have two or more dependent variables.
The table helps to quickly identify the right Analysis of Variance to choose in different scenarios. The factorial ANOVA should be used when the research question asks for the influence of two or more independent variables on one dependent variable.
Examples of typical questions that are answered by the ANOVA are as follows:
- Medicine – Does a drug work? Does the average life expectancy differ significantly between the 3 groups x 2 groups that got the drug versus the established product versus the control and for a high dose versus a low dose?
- Sociology – Are rich people living in the country side happier? Do different income classes report a significantly different satisfaction with life also comparing for living in urban versus suburban versus rural areas?
- Management Studies – Which brands from the BCG matrix have a higher customer loyalty? The BCG matrix measures brands in a brand portfolio with their business growth rate (high versus low) and their market share (high versus low). To which brand are customers more loyal – stars, cash cows, dogs, or question marks?
The Factorial ANOVA in SPSS
Our research question for the Factorial ANOVA in SPSS is as follows:
Do gender and passing the exam have an influence how well a student scored on the standardized math test?
This question indicates that the dependent variable is the score achieved on the standardized math tests and the two independent variables are gender and the outcome of the final exam (pass or fail).
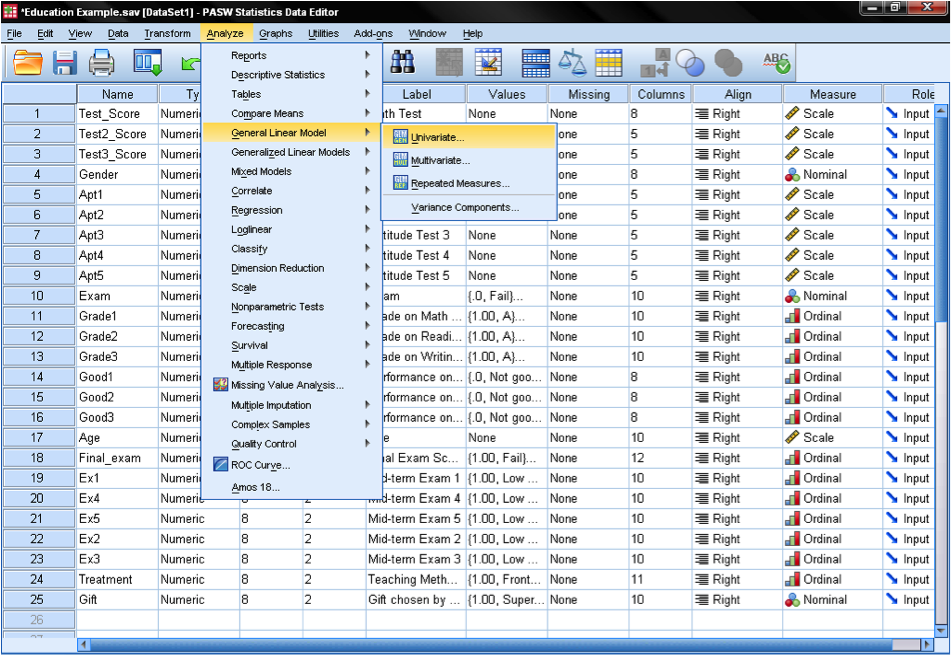
The factorial ANOVA is part of the SPSS GLM procedures, which are found in the menu Analyze/General Linear Model/Univariate.
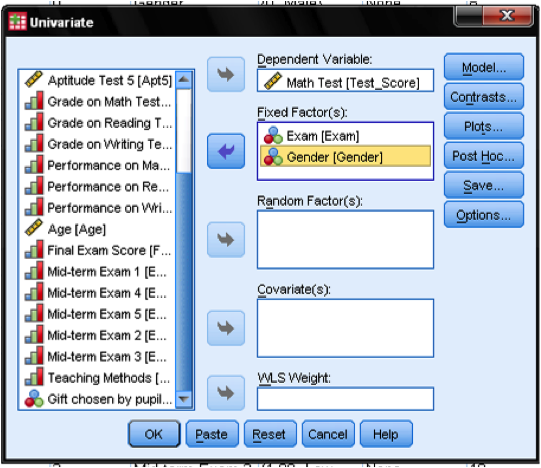
In the GLM procedure dialog we specify our full-factorial model. Dependent variable is Math Test with Independent variables Exam and Gender.
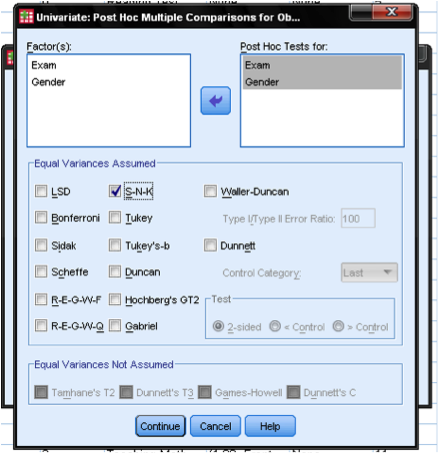
The dialog box Post Hoc tests is used to conduct a separate comparison between factor levels. This is useful if the factorial ANOVA includes factors that have more than two factor levels. In our case we included two factors of which each has only two levels. The factorial ANOVA tests the null hypothesis that all means are the same. Thus the ANOVA itself does not tell which of the means in our design are different, or if indeed they are different. In order to do this, post hoc tests would be needed. If you want to include post hocs a good test to use is the Student-Newman-Keuls test (or short S-N-K). The SNK pools the groups that do not differ significantly from each other. Therefore it improves the reliability of the post hoc comparison by increasing the sample size used in the comparison. Another advantage is that it is simple to interpret.

The Options dialog allows us to add descriptive statistics, the Levene Test and the practical significance (estimated effect size) to the output and also the mean comparisons.
The Contrast dialog in the GLM procedure model us to group multiple groups into one and test the average mean of the two groups against our third group. Please note that the contrast is not always the mean of the pooled groups! Contrast = (mean first group + mean second group)/2. It is only equal to the pooled mean if the groups are of equal size. In our example we do without contrasts.
And finally the dialog Plots… allows us to add profile plots for the main and interaction effects to our factorial ANOVA.
Need More Help?
Check out our online course for conducting an ANOVA here.
Statistics Solutions can assist with your quantitative analysis by assisting you to develop your methodology and results chapters. The services that we offer include:
Edit your research questions and null/alternative hypotheses
Write your data analysis plan; specify specific statistics to address the research questions, the assumptions of the statistics, and justify why they are the appropriate statistics; provide references
Justify your sample size/power analysis, provide references
Explain your data analysis plan to you so you are comfortable and confident
Two hours of additional support with your statistician
Quantitative Results Section (Descriptive Statistics, Bivariate and Multivariate Analyses, Structural Equation Modeling, Path analysis, HLM, Cluster Analysis)
Clean and code dataset
Conduct descriptive statistics (i.e., mean, standard deviation, frequency and percent, as appropriate)
Conduct analyses to examine each of your research questions
Write-up results
Provide APA 6th edition tables and figures
Explain chapter 4 findings
Ongoing support for entire results chapter statistics
Please call 727-442-4290 to request a quote based on the specifics of your research, schedule using the calendar on this page, or email [email protected]