
When discussing your results, it is always important to discuss those results in context. This means talking about how the results apply to other situations and previous literature/studies. What is important about this step is that the researcher does not under or overgeneralize the findings. To do this, a researcher should use what is known as hedging language throughout their paper.
Hedging language is the idea of using cautious or vague language when discussing the implications of results. When talking about results, no matter what they are, they do not “prove” anything. Instead, the researcher is attempting to learn more about a larger population from a smaller sample, meaning that they often make guesses based on that sample. Additionally, research is an ever-changing process. What we know today could change tomorrow with a revolutionary new study published. It is important for a researcher to keep this in mind when discussing results.
Here are some examples of hedging language:
- Instead of “the results prove that…”- maybe use “the results suggest that…” or “the results indicate that…”
- Use words such as “probably”, “could”, or “might”, instead of words such as “definitely”, “does”, or “will”
- Other hedging words/phrases: appear to be, looks like, assume, one possible explanation is…, etc…
Finally, it is important to note that the only section of a research paper in which hedging language should not be used is Chapter 4- the results. This is because, in chapter 4, the researcher should just be reporting the data. Any interpretation of the results, however, should always include hedging language.
A common research design used by doctor of nursing practice (DNP) students is a simple pretest/posttest design. Say you want to implement an educational program in your nursing unit to see if it will increase nurses’ knowledge or competency. You might have a sample of nurses complete a pretest that assesses their current knowledge, and then have the nurses take the test again (i.e., a posttest) after they participate in your educational program. If the nurses perform better on the posttest compared to the pretest, you would have some evidence demonstrating the effectiveness of your program.
Setting Up Data for a Simple Pretest/Posttest Analysis
Although many DNP students use this approach, they often struggle when analyzing the data. An area of confusion for some students is how to set up the data properly. In this blog, we will demonstrate the correct way to set up data for a simple pretest/posttest analysis, with examples for two statistical software programs (SPSS and Intellectus Statistics). Note that these instructions apply only if you can match your pretest and posttest data (i.e., the same individuals took both tests, and you have identifiers to pair their responses). If you cannot match the data, follow a different procedure.
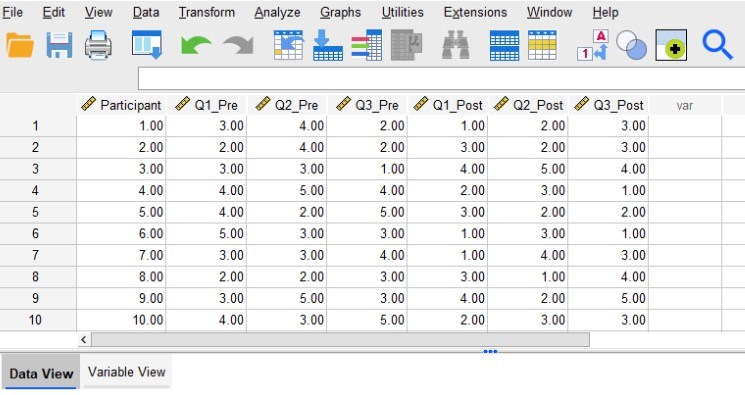
For this example, let’s say we have data from 10 participants. Each participant completed both a pretest and a posttest assessment. The assessment consisted of three questions (Q1, Q2, and Q3) that participants answered using a 1 to 5 Likert scale. Therefore, each participant has provided answers to three pretests questions and three posttest questions. The first image below shows what the data should look like in SPSS’s “Data View.”
Need help conducting your analysis? Leverage our 30+ years of experience and low-cost service to complete your results!
Schedule now using the calendar below.
Structuring Data for Pretest/Posttest Analysis
The first column labeled “Participant” contains the identification numbers for our 10 participants. Assigning participants an identification number (or having some other kind of identifier) allows us to match their pretest and posttest responses. The next three columns (Q1_Pre, Q2_Pre, and Q3_Pre) contain the participants’ pretest responses. Similarly, the last three columns (Q1_Post, Q2_Post, and Q3_Post) contain the participants’ posttest responses. Notice that underneath these column labels we have 10 rows of data corresponding to our 10 participants.
The data should be set up so that all of the data from each participant lines up in a single row. So, all of Participant 1’s answers are entered in row 1, all of Participant 2’s answers are entered in row 2, and so on. This is why having identification numbers is important, as they will help ensure that each participant’s pretest and posttest answers can be matched and entered into the same row.
The next image below shows how the same data should look when entered in Intellectus Statistics. Notice how the structure of the data is the same as it was in SPSS. We have a column (A) containing the participant identification numbers, and columns (B-G) containing the data for each pretest and posttest question. We entered data for 10 participants in 10 rows, ensuring that all data from each participant appear in the same row.
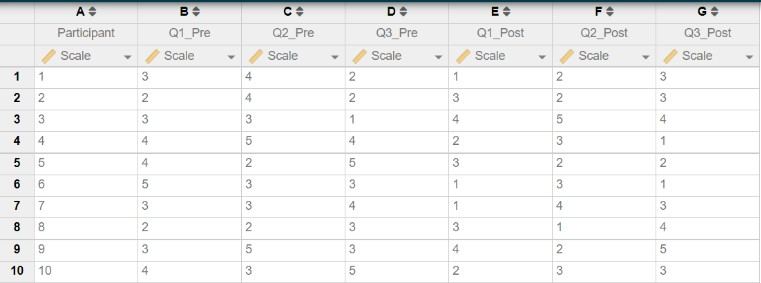
Once you have the data set up this way, you may compute composite scores (if it is appropriate to do so with the instrument/assessment you are using) or begin running analyses (e.g., paired t-tests) to compare your pretest and posttest responses.
Power, or the ability to detect an effect if there is one present, is an important tool used to reduce the chances of a type II error. Power can be thought of as sensitivity, meaning that the more power that is present, the more likely we are to be able to detect an effect if it is there.
There are a few aspects of a research study that can affect how much power an analysis will have. First of which is the alpha level, or the cutoff value for deeming significance. While the standard alpha for deeming significance is .05, lower alpha values will decrease the amount of power present which in turn can increase the chance of type II errors. Higher alpha levels, on the other hand, will increase power but in turn can increase the chance of a type I error. Another aspect of a research study that can affect power is the sample size. Larger sample sizes create artificial differences between participants, meaning that the more data that is collected, the greater power you will have.
Next, effect size, or how large of a difference is there, can affect power. This means that when there is a larger effect size, there is a greater difference between the groups. Therefore, power will be high. However, a small effect size will take more power to be able to detect an effect. Finally, the last aspect of a study that can impact power is the statistical test itself. Some tests have more sensitivity than others, and the simpler the test the more power there is to detect an effect.
In research, a power analysis is most often run prior to data collection so that the researcher can determine the minimum sample size needed to have enough power to detect an effect. This is commonly done through a software known as G*power.
G*power is a free statistical software that allows the user to determine statistical power based on a wide variety of tests. The user can specify the type of test being run, their desired level of power, and alpha level to determine the sample size needed. The rest of this blog will show each step to determine the sample size needed for a paired samples t-test.
Need help determining sample size for your research? Leverage our 30+ years of experience and low-cost same-day service to make progress on your project today!
Schedule now using the calendar below.
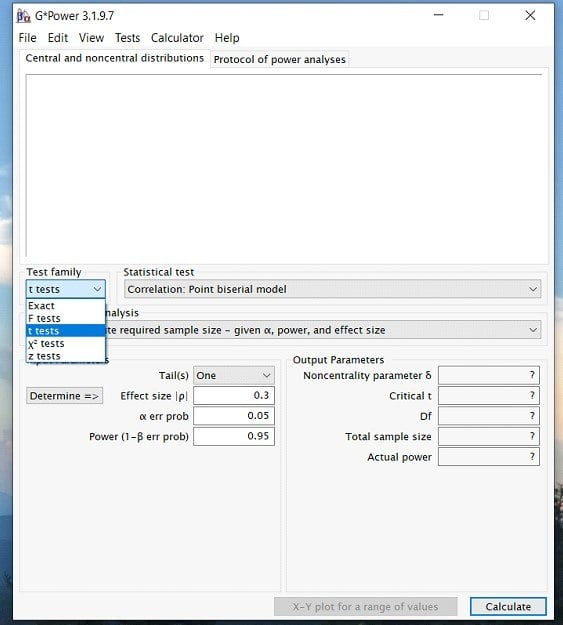
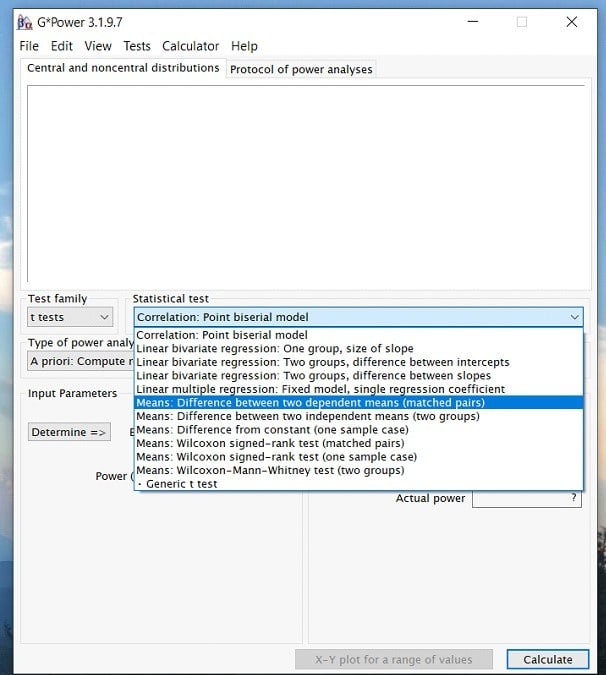
Step 1: Open G*power. Once you open the program, a popup window will appear that looks like this…
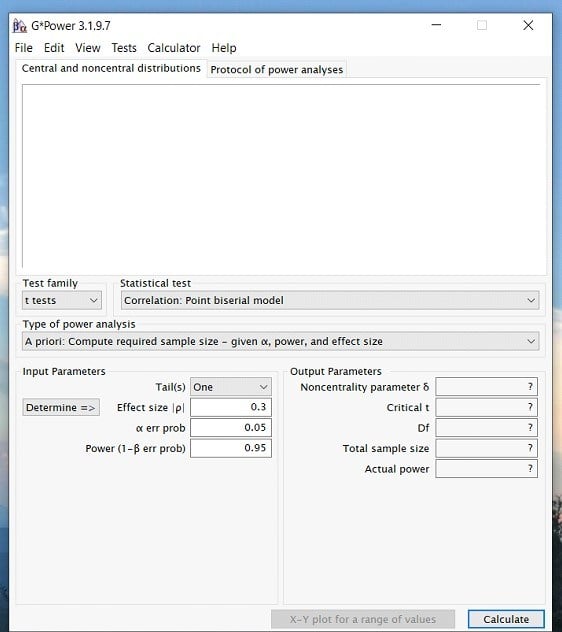
Step 2: Once you have opened the program. Click on the Test family drop down menu and select the type of statistic you are interested in. For a paired samples t-test, we will select the t-test option. However, if you are interested in an ANOVA or Regression then you would select the F test option.
Step 3: Once you have determined the test family, you can click on the statistical test drop down menu and select the appropriate test for your analysis. In this case, we would choose the Means: Difference between two dependent means (matched pairs). Again, this is because we are running a paired samples t-test.
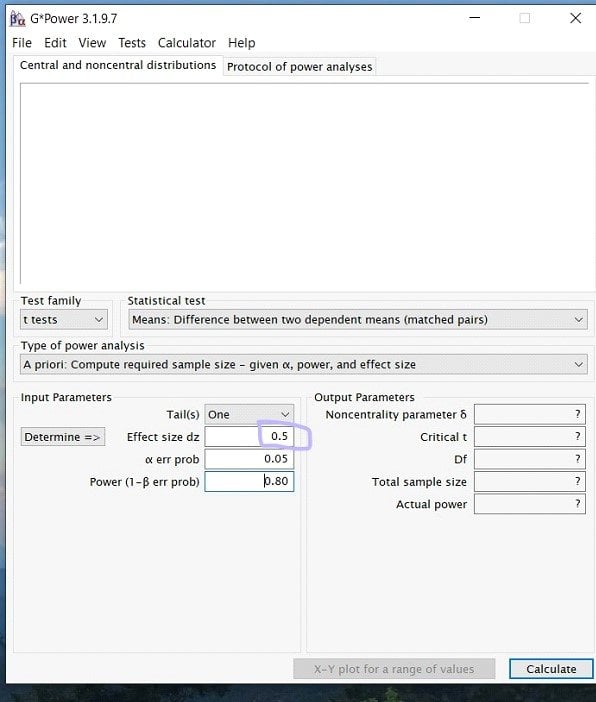
Step 4: Once you have selected your test, you will now be able to input the effect size, power, and alpha levels. (Note: depending on the test you may also have to know the group sizes, etc.)
Starting with effect size! What you put for your effect size is largely dependent on researcher discretion. This means that similar previous studies and literature should inform the researcher if a high, medium, or low effect size is appropriate. If you do not know the appropriate effect size, there is a determine button on g*power to help. Here, we decided to go with a medium effect size of .5.
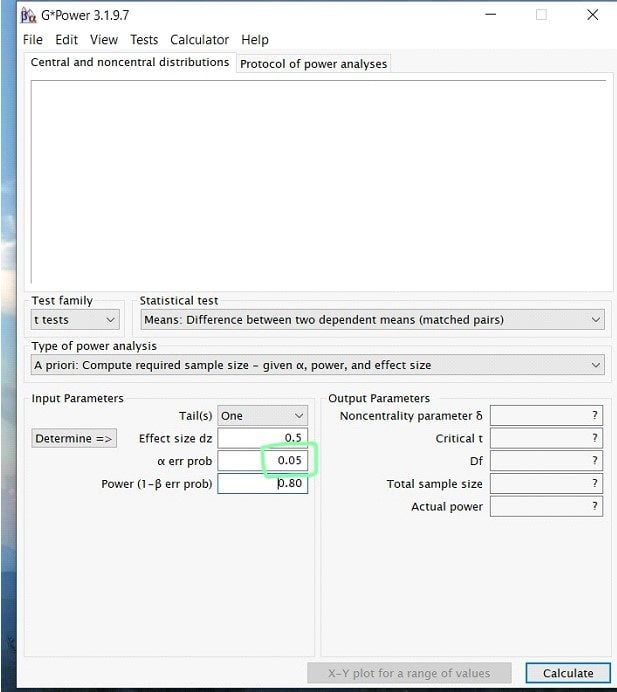
Step 5: Next to input the alpha level. For this, unless previous research has given you a reason to lower the value, it is a safe bet to always stay at alpha= .05.
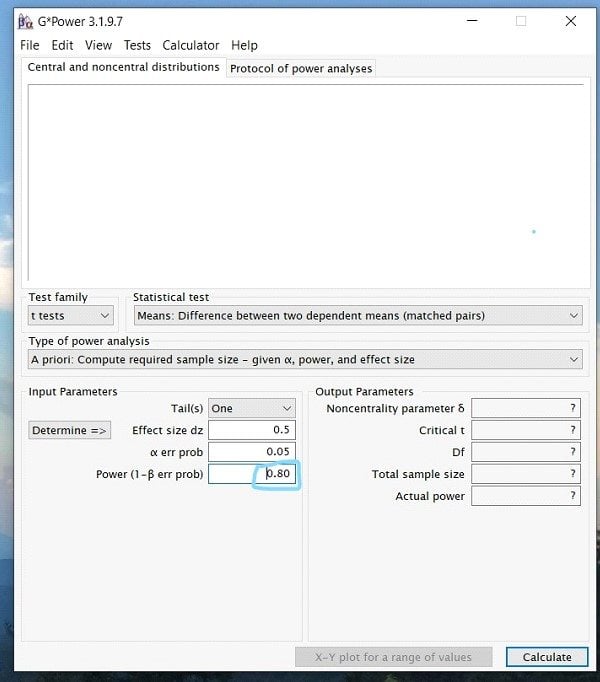
Step 6: Finally, you will enter your desired power value. In most research studies, the widely accepted level of power is .80 or above. Therefore, unless previous literature prompts you to use a larger power, always use .80.
Step 7: Once you have inputted all the appropriate numbers, press calculate, and you should see a screen that looks like this …
While this looks like a lot of information, what is important when running a power analysis for the sample size is the Total Sample Size number under Output Parameters. In this case, for a paired sample t-test, the total sample size needed would be 27.
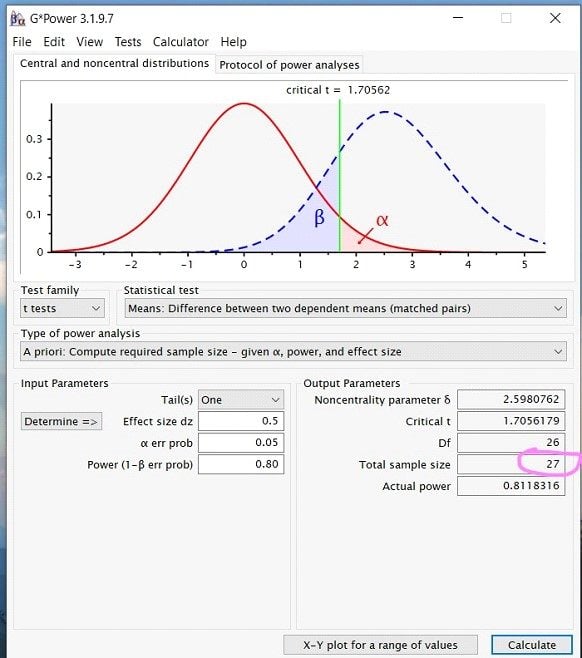
Finally, to report your power analysis, you would write up something along the lines of… A power analysis for a one-tailed paired-samples t-test indicated that the minimum sample size to yield a statistical power of at least .8 with an alpha of .05 and a medium effect size (d = 0.5) is 27.
Take the Course: Sample Size and Power Analysis
Managing missing data is an important step in the data analysis process. Missing data almost always happens; people drop out of studies or skip a few questions on a survey. It’s crucial to determine if data is missing randomly or follows a systematic pattern affecting results. Therefore, researchers categorize missing data in three ways: MCAR (missing completely at random), MAR (missing at random, ignorable), and MNAR (missing not at random, unignorable). Although no set standard exists for acceptable missing data, many experts suggest tolerating less than 5%.
After identifying unignorable missing data, the next step is deciding how to address it. The most common approach is to remove cases with missing data from the analysis. Programs such as SPSS and SAS will delete these missing values automatically. One downside to this option, however, is the potential for a large loss of data. Especially if missing cases spread randomly throughout the data. Therefore, a researcher can choose to estimate the values of the missing data in a variety of ways. One way could be to use prior knowledge of the literature to make an educated guess on what the value should be.
This method can be biased by researchers’ beliefs about the study. It assumes that values remain unchanged over time. Some researchers prefer mathematical approaches to estimate missing values. These methods include mean substitution or using predicted values from regression. Regression-based estimates are more objective and may align better with existing data than real scores. Some researchers run analyses with and without missing data to check for differences in results. Experts highly recommend this option when a data set is small and contains a large amount of missing data.
Overall, there are many ways to deal with missing data, all accompanied with several pros and cons to consider. It is up to the researcher to determine the pattern of missing data and the appropriate solution to deal with it based on the study in question.
As a qualitative mentor, a question I am frequently asked is, “How do I select the right sample size?”. There is no short answer or hard and fast rule for this. As with all things, there is nuance here, and much of this depends on other factors of your study. This post offers strategies for selecting the right sample for your qualitative study.
The key to finding the right number of participants to recruit is to estimate the point at which you will reach data saturation, or when you are not gleaning new information as you add participants. Practically speaking, this means that you are not creating new codes or modifying your codebook anymore. Guest et al. (2006) found that in homogeneous studies using purposeful sampling, like many qualitative studies, 12 interviews should be sufficient to achieve data saturation.
Need help conducting your analysis? Leverage our 30+ years of experience and low-cost same-day service to make progress on your results today!
Schedule now using the calendar below.
However, there are qualifications here, including specifics of a data set as well as a researcher’s experience or tendency to lump or split categories. More recently, Hagaman and Wutich (2017) explored how many interviews were needed to identify metathemes, or those overarching themes, in qualitative research. In contrast to Guest’s (2006) work, and in a very different study, Hagaman and Wutich (2017) found that a larger sample of between 20-40 interviews was necessary to detect those metathemes.
You can see that between these two articles, there is variation in sample size and the number of participants necessary to reach data saturation. These should, however, provide some guidance and a starting point for thinking about your own sample. At a minimum, you probably want to begin with a sample of 12-15 participants. Plan to add more as needed if you do not believe you have reached saturation in that amount.
References
Guest, G., Bunce, A., & Johnson, L. (2006). How many interviews are enough?: An experiment with data saturation and variability. Field Methods, 18(1), 59.82. https://doi.org/10.1177/1525822X05279903
Hagaman, A. K., & Wutich, A. (2017). How many interviews are enough to identify metathemes in multisited and cross-cultural research? Another perspective on Guest, Bunce, and Johnson’s (2006) landmark study. Field Methods, 29(1), 23-41. https://doi.org/10.1177/1525822X16640447
Once the data collection process has completed, it is time to start cleaning your data so it is ready to run descriptive and inferential analyses. There are many statistical software packages that can be used for the data cleaning and management step. To illustrate the various steps of data management, SPSS will be utilized.
1) If using data collection programs like Survey Monkey or Qualtrics, data can be downloaded directly into SPSS format (.sav extension). You can also upload a spreadsheet from Excel format (.xls or .csv extensions) directly into SPSS.
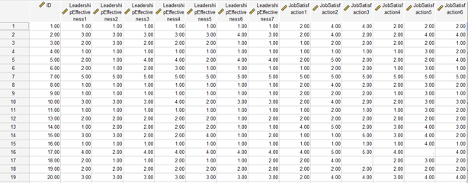
2) Add an ID variable so every participant can be quickly identified with a number. Throughout the data analysis, you will be sorting your data in a different order. With this ID column you can revert back to the original order by sorting the ID in ascending order. This is a good way to keep track of participants if you are making removals for partial responses or outliers.
3) Name every variable that will be used in the spreadsheet. Use Excel to quickly autofill variables with ascending numbers (ex: jobsatisfaction1, jobsatisfaction2, jobsatisfaction3, etc). Try to use a short and concise phrase (with no spaces) so you can easily identify what the items are measuring.
4) Save your spreadsheet after every major adjustment (recoding or removing cases).
Note the screenshot below in which an ID column has been added in ascending order. The variables of interest have been renamed to short phrases with sequential numbers.
Next, you want to recode ordinal or Likert-scale data from string format (words) to numeric format. You will also want to review the scoring instructions for the surveys to identify if reverse scoring is necessary. Reverse scoring is typically necessary if there are combinations of positively phrased and negatively phrased items. Most scoring guides will identify where to reverse score. Both steps can be performed under the Transform menu in SPSS. There are two options to use: “Recode into Same Variables” or “Recode into Different Variables”. I tend to use the “Recode into Different Variables” option because it can be beneficial to keep the original variables in the spreadsheet, while adding the new recoded variables. You may need the original coding if a committee member is reviewing the data and wants to see the variables in their raw (original) format.
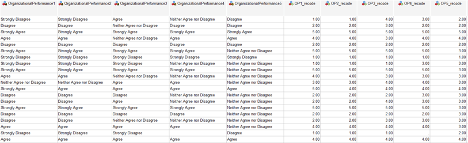
Note in the screenshot below, all five “organizational performance” items are in string format – which essentially means letters and words. We need to assign numeric meaning to the Likert-scale by converting the words to numbers using the “Recode into Different Variables” option. The first five items in the screenshot represent the original coding of string-format responses, and the last five items (OP1_recode to OP5_recode) represent the recoding to numeric format. The recode has changed the variables from Strongly Disagree to 1, Disagree to 2, Neither Agree nor Disagree to 3, Agree to 4, and Strongly Agree to 5. Side-by-side, we can see the original variables and the recodes.
The next step of the data cleaning process is to handle missing data. There are many ways to deal with missing responses. If your sample size is far above your minimum requirement (as calculated with a power analysis), then it may be acceptable to remove participants that did not complete the survey. Some statisticians argue for predictive techniques such as imputation. Other statisticians support the use of mean or median replacement. Check with your committee if they have a preference for missing data replacement methods. Under the Transform menu, we can use the “Replace Missing Values” option to substitute the missing scores with means (averages) or medians.
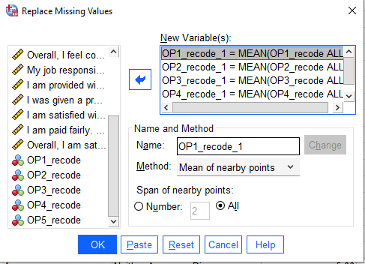
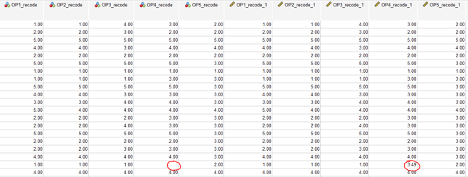
Note how in the screenshot below, the missing value in OP4_recode has now been replaced with the mean (3.49) in a newly created variable OP4_recode_1. The “replaced missing values” variables will all have a “_1” following the original variable name.
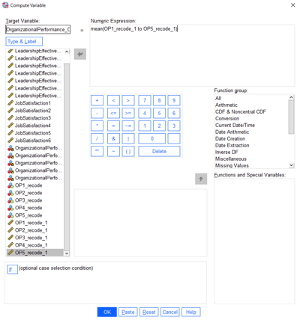
The next step is creating composite scores for the variables of interest. This step may require searching the internet for scoring instructions on the particular survey that was administered. Most of the time, an average or a sum is computed from the series of Likert-scale items. In some cases, each survey item will need to be examined independently as opposed to creating a composite score. To generate composite scores, use the Transform -> Compute Variable command in SPSS. To illustrate with an example, the Organizational Performance variable for this study was computed through an average of the five items comprising the survey. First, we need to give the composite variable a name such as OrganizationalPerformance_Overall. Then, we need to identify that a mean is being computed of the five items. Running this code generates a new variable which will represent overall organizational performance.
After the data have been cleaned to account for string variables, missing responses, and generation of composite scores – the data are essentially ready for analysis. The next step is analyzing the data. Keep in mind that depending on the inferential analyses that were proposed (regression, t-tests, ANOVAs, etc), there are specific statistical assumptions that should be verified such as removal of outliers, normality, homogeneity of variance, etc. There are numerous ways to verify that these assumptions are supported. Please review our other blogs and webinars in which assumption testing is discussed.
A mediational hypothesis tests whether a third variable mediates (or accounts for) the relationship between an independent and dependent variable. Researchers refer to this third variable as a mediating variable. The mediating variable aims to fully mediate the relationship so that, when added to a model, it eliminates the independent variable’s effect on the dependent variable.
Researchers Baron and Kenny list out a series of four required steps to follow when running a mediational hypothesis. The researcher first determines whether the initial variable correlates with the outcome variable. This is important because it establishes that there is an effect for a third variable to mediate. Similarly, steps two and three are related to determine that there is a correlation between the initial variable and the mediator variable and between the outcome variable and the mediator variable. Finally, the last step is to establish the complete mediation across the variables. This means that adding the mediation variable will reduce the initial variable’s effect on the outcome variable to zero.
If the data satisfies all four of these steps, then according to the researchers, the data is reliable for a mediational hypothesis to work. It is important to note, however, that the completion of these steps does not mean that mediation has occurred, only that a mediation is one plausible model that would fit the data.
Need help with your project? Leverage our 30+ years of experience and low-cost service to make progress on your results!
Schedule now using the calendar below.
Related Pages:
This blog is about two important aspects of the literature review: synthesis and analysis. Similarly, the literature review chapter typically contains an introduction, literature search strategy, a review of the literature, and a summary. Consequently, it may also contain the theoretical or conceptual framework, so check your school’s template to be sure. Synthesis and analysis pertain to the review of the literature section, which is the bulk of the literature review chapter.
Let’s start by being clear about the purpose of the literature review. The purpose of the literature review is to synthesize and analyze previous research on your study topic. Particularly to make a case for your research problem. The purpose of the literature review is not only to provide a research context or describe previous research. If that were the case, an annotated bibliography would suffice. Bringing the findings and conclusions of studies together (synthesis) and commenting on trends and shortcomings (analysis). As well as relating these to the need for your study, provide an overall argument. Specifically for your research problem and why your study is needed.
Let’s dive a little deeper into synthesis and analysis.
Synthesis and Analysis:
Synthesis simply means the combination of parts to form a whole. For the literature review, this involves combining important information from studies to make your points. Important information from studies can include the purpose, participants, variables studied or major concepts, how data were analyzed, and findings or conclusions. Synthesize at the paragraph level using standard paragraph organizational strategies. This includes having a topic sentence, evidence or discussion of the topic (several sentences), and a summary sentence. That may also lead into the next paragraph or topic. Professors may also refer to this organizational strategy as the MEAL plan: Main idea, Evidence, Analysis, and Lead out.
Here is an example of synthesis at the paragraph level, color coded by topic, evidence, and summary:
Topic sentence, evidence related to or discussion of the topic, and a summary or transition:
Recent research has mostly shown that health literacy is an important factor in diabetic self-control and positive outcomes. (Anders et al., 2018; Gregory et al., 2018; Talbot et al., 2018). Anders et al. (2018) conducted a systematic review on the concept of health literacy and how it relates to self-efficacy, diabetic control, and diabetic outcomes. Anders et al. found that limited health literacy reduces effective self-management resulting in poor diabetes control and clinical outcomes among individuals with type 2 diabetes.
Gregory et al. (2018) reviewed 117 recent studies on the relationship between health literacy and type 2 diabetes mellitus and found consensus on the definition of health literacy and health literacy measurement indices, helping to corroborate the relationship between health literacy and type 2 diabetes mellitus knowledge. In a quantitative study involving 55 patients with type 2 diabetes, Talbot et al. (2018) found a significant positive relationship between diabetes knowledge and glycemic control using an instrument that assessed patient knowledge. Unlike Anders et al. and Talbot et al., however, Philips et al. (2019) found no statistically significant relationship between diabetes knowledge and glycemic control, which they attributed to a small sample size and possibly errors associated with self-reported instruments. Empirical evidence from recent research largely supports that diabetic health literacy is a vital component of patients’ self-efficacy, diabetic control, and clinical outcomes.
Contribution throughout the literature:
You may notice that the paragraph above also contains some analysis. Meanwhile, the text, “helping to corroborate the relationship between health literacy and type 2 diabetes mellitus knowledge” and “which they attributed to a small sample size and possibly errors associated with self-reported instruments” are examples of analysis. Therefore, the first is a comment on how the study contributed to the literature. And the second highlights the weaknesses of the study. That may explain why the study’s findings do not align with the findings of the other studies. Also note the qualifying words, “mostly” and “largely,” in the first and last sentences to highlight that not all the research is in consensus. So, you can analyze the research (comment on weaknesses and trends or explain how the research relates to your study) throughout the synthesis, wherever there are opportunities to do so.
HIPAA Compliance in Research: Protecting Privacy and Ensuring Security of Health Data
The IRB is responsible for evaluating compliance with regulations set forth by the Health Insurance Portability and Accountability Act (HIPAA) in research involving human subjects. HIPAA establishes the guidelines for protecting individuals’ health data during research by creating, obtaining, using, or disclosing the information. The primary focus is on safeguarding identifiable information related to an individual’s medical history, current condition, future healthcare payments and any other information that relates to an individual’s healthcare. HIPAA encourages individuals to contact the organization’s authorities or federal/state agencies if they have complaints or questions about protection efforts.
HIPAA defines research as a systematic investigation that involves developing, testing, and evaluating data to contribute to generalizable knowledge. However, certain investigative activities that involve patient data, such as investigations for quality assessment or improvement of guidelines and protocols, do not qualify as research under this definition. In this case, different HIPAA rules would apply.
If the dataset falls within the definition of research, HIPAA requires explicit authorization (consent) from the subject for the use of the data. Just like all consent, the subject can revoke it at any time, and they must provide written notice of withdrawal of consent. In some cases, HIPAA does allow for research related access to data without consent. A researcher does not need consent from individual data subjects in the following cases: when the research poses minimal risk, is solely for research activities, only uses information from deceased individuals, or has been grandfathered in from before legal permissions were in place. Also, when all direct identifiers related to the data are removed, meaning data is fully de-identified, researcher does not require consent.
In addition to protecting individual health information privacy, researchers are also responsible for ensuring the security of individual health information. The security rule requires researchers to inform each subject about the specific security measures implemented to protect their data.
Need assistance with your research?
Select a time to speak with an expert using the link below
When reviewing a research design, IRB committee members consider many different rules. A common rule in reviewing is to reasonably maintain the privacy and confidentiality of participants. This means that researchers have an obligation to give the participant control over what and how much information they share (privacy). Also, protecting the information that participants do disclose (confidentiality).
Privacy, or controlling the extent, timing, and circumstances of what one shares, can breach in many ways. One way is through different research methods, such as observational studies, focus groups, and snowball sampling. Observational studies pose a threat to privacy. If one gathered private information without the subject’s knowledge, while they cannot ensure privacy they may discuss after the study. Additionally, privacy invasions occur if the participant finds the study questions to be invasive.
Questions about sensitive topics, such as abuse, medication, or sexual behavior, may serve to make the participant uncomfortable and studies that include these types of questions should include a warning in the consent form. Therefore, one can protect a participant’s privacy by taking appropriate data collection measures and reviewing research questions for privacy concerns. However, the researcher must determine the reasonable assumption of privacy on a case-by-case basis, as nuances exist in these concepts. This happens because what seems like private information in some situations may not be problematic to share in others, such as medical or income information.
Confidentiality refers to handling information shared with the expectation it won’t be disclosed to others. A simple way to protect confidentiality is to de-identify participant information or assign numbers to prevent identification. Additionally, one should outline the protection of data and information in clear writing in the consent form.