Hypotheses are testable statements that link to your research question. Hypotheses link the research question to concise statements about the connection between variables. For example, if studying how mentoring affects first-generation students’ intention to stay at university, the research question could be:
“Does the presence of a mentoring relationship influence first-generation students’ intentions to remain at their university?”
Though this statement outlines the construct and variables, it doesn’t specify what we’re testing. We use the hypotheses to make this clear. Specifically, we create null and alternate hypotheses to indicate exactly what we intend to test. The null hypothesis suggests no observable difference or relationship, while the alternate hypothesis suggests there is one.
In the example above, itwould be as follows:
Null hypothesis: The presence of a mentoring relationship does not influence first-generation students’ intention to remain at their university.
Alternate hypothesis: The presence of a mentoring relationship influences first-generation students’ intention to remain at their university.
Need help conducting your analysis? Leverage our 30+ years of experience and low-cost same-day service to complete your results today!
Schedule now using the calendar below.
It may be worded with or without a direction. As written above, it does not have a direction. To give them direction, we would consult previous literature to determine how a mentoring relationship is likely to influence intention to remain in school. If the research indicates that the presence of a mentoring relationship should increase students’ connections to the university and their willingness to remain, our alternate hypothesis would state:
“The presence of a mentoring relationship increases first-generation students’ intention to remain at their university.”
If the research indicates that the presence of a mentoring relationship minimizes students’ desire to make additional connections to the university and in turn decreases their willingness to remain, it would state:
“The presence of a mentoring relationship decreases first-generation students’ intention to remain at their university.”
Once you conduct your statistical analysis you will determine if it should be rejected in favor of the alternate hypothesis.
After completing the proposal, IRB, and data collection process, the results chapter can be daunting task for many students. However, if sufficient planning is done, the results chapter can be the most straightforward and efficient chapter of your dissertation. Communication with your committee (specifically your chair and methodologist) is vital to this process.
Assuming you have written a detailed data analysis plan in your proposal, it is important to develop an outline for how the results chapter will be presented. Make note of all pre-analysis screening steps, such as removing outliers and dealing with incomplete or partial responses. Identify the descriptive statistics, charts, and figures that will be presented in the chapter. List the statistical assumptions that will be tested and have a backup plan ready if there are any violations. Finally, describe the inferential tests that will be used to address each research question, including the specific variables in your dataset that will be used in each analysis. Review the outline of the chapter with your committee to ensure there are no surprises from either side.

After analyzing the data and writing the results chapter, it is possible a committee member will suddenly request an additional analysis. Many times, these requests are valid points and can strengthen your chapter. But other times, the recommendations do not bolster the statistical findings of the results. This is when the outline can be used to justify the presentation that was initially agreed upon. Also make sure to save all spreadsheets, syntax, and output files in the rare scenario that the university requests an audit on the findings. Following the suggestions above can make for a much smoother and faster process as you complete your results.
You have set the methodological stage, entered your data, and you are getting ready to run those fancy analyses you have been anticipating (or dreading) all this time. If you have already read our overview on some of SPSS’s data cleaning and management procedures, you should be ready to get started. But wait! You are using a parametric analysis, and you know that stats book you read said something about normality. It is important, but what is it, and how do you know if your data follows normality? Well, first it is important to know what kind of normality you are looking for. There are two main types: univariate and multivariate.
Here we will talk about univariate normality. This goes along with the concept of the bell curve, which is the depiction of data with a lot of “middle-ground” scores, but only a few high or low scores. This follows the figure here, where the vertical (y) axis represents the number of people (or observations) with low, average, and high scores.
Need help conducting your analysis? Leverage our 30+ years of experience and low-cost same-day service to complete your results today!
Schedule now using the calendar below.
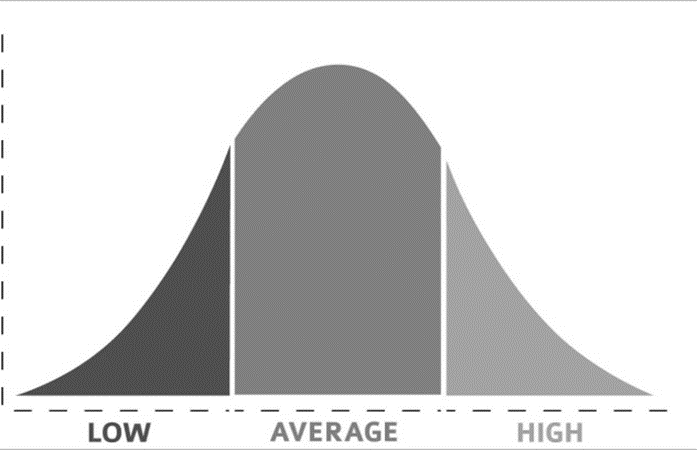
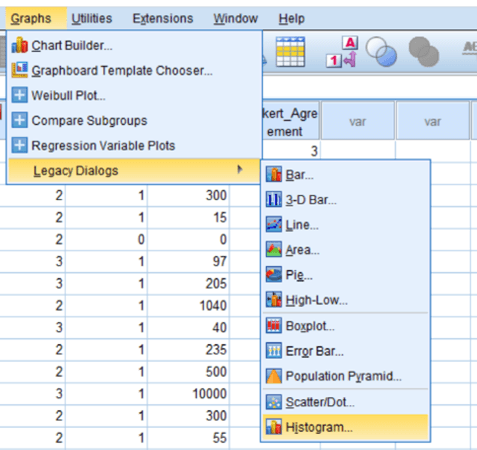
A few deviations from this distribution can exist. For example, shifting the hump to one side creates skew. A high skew can mean there are disproportionate numbers of high or low scores. On the other hand, platykurtosis and leptokurtosis happen when the hump is either too flat or too tall (respectively). In SPSS, go to Graphs > Legacy Dialogs > Histogram and select your variable. Clicking OK should show you a chart that looks similar to the one above. If your distribution does not follow a typical bell shape, you might need to dig into the numbers.
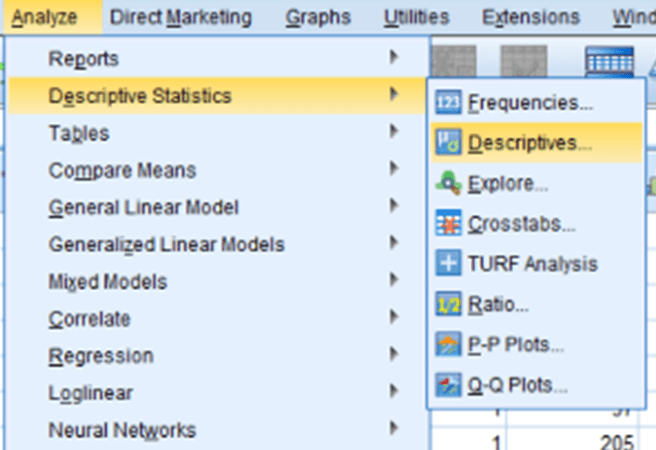
To get skew and kurtosis values in SPSS, go to Analyze > Descriptive Statistics > Descriptives and select your variables. Clicking on Options… gives you the ability to select Kurtosis and Skewness in the options menu. Click OK and check for Skew values over 2 or under -2 and Kurtosis values over 7 or under -7. Those values might indicate that a variable may be non-normal.
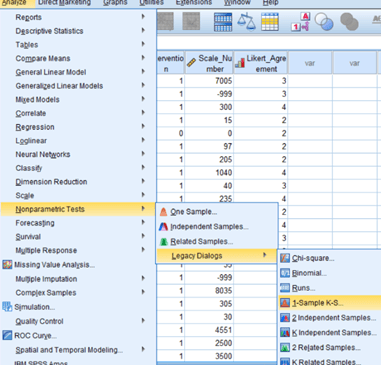
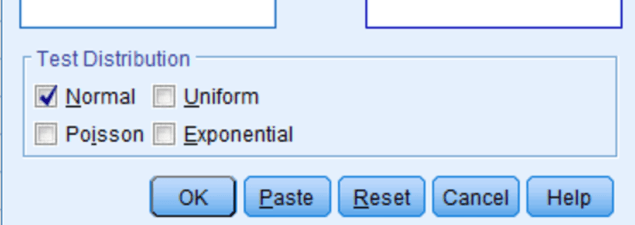
With all that said, there is another simple way to check normality: the Kolmogorov Smirnov, or KS test. This test checks the variable’s distribution against a perfect model of normality and tells you if the two distributions are different. You can reach this test by selecting Analyze > Nonparametric Tests > Legacy Dialogs > and clicking 1-sample KS test. Just make sure that the box for “Normal” is checked under distribution.
Check the difference from a normal distribution using a p-value, interpreted like any other. A p-value < 0.05 means a significant difference from normality, which may be a concern. A p-value ≥ 0.05 means no significant difference, so normality-dependent analysis can proceed.
In a previous blog, we began a discussion on selecting participants in qualitative research studies, including the initial steps you should take to determine who should participate in your study. Here, we will explain the importance of inclusion and exclusion criteria and how such criteria are used to guide participant selection.
Inclusion criteria refer to characteristics that your potential participants must have in order to participate in the study. For example, if you are conducting a study on the experiences and perceptions of high school principals, one of your inclusion criterion might be that participants must have served as a principal at a high school for at least three years. Another common inclusion criterion is age; unless you are specifically studying minors or some other age group, you should require that participants are old enough to provide legal consent (typically 18 years old). Establishing specific inclusion criteria is especially important in qualitative research because it helps ensure that the individuals who participate can provide you the information necessary to address your research questions.
Exclusion criteria are any characteristics that potential participants might have that would disqualify them from participating in the study. For example, you might exclude participants if they are considered part of a vulnerable population (e.g., incarcerated individuals or pregnant women) or if they have an illness or disability that might affect their ability to give consent or would otherwise make it dangerous for them to participate in the study. Note that your exclusion criteria are not simply the opposite of your inclusion criteria. Exclusion criteria are put in place to protect potential participants and to maintain proper ethical standards, in addition to ensuring that your sample is appropriate for addressing your research questions. When considering exclusion criteria, you need to be aware of your role as the researcher and your relationship to potential participants. For instance, if you were a medical or mental health professional, you would probably want to exclude your own patients from participating, as this would present a conflict of interest. Your exclusion criteria need to be carefully considered so that you conduct your study ethically and only interview participants who will give you relevant information; but at the same time, you do not want to unnecessarily exclude individuals from populations that might benefit from your research.
Need help conducting your analysis? Leverage our 30+ years of experience and low-cost service to make progress on your results!
Schedule now using the calendar below.
Click below to see a testimonial from a satisfied Intellectus customer!
In the next installment of this blog series, we will describe some methods you can use to select participants who meet your inclusion and exclusion criteria.
Filling in a checklist is a common request of chairs for Walden students. Whether you are doing a qualitative or quantitative study does not matter, the checklists are very similar and should be approached similarly. However, do make sure that you are using the correct one because there is content in each one that is specific to that methodological approach.
First, the content requirements of the checklist are directly aligned with the school template and guide. If you have fulfilled the requirements of the rubric, you will have all of the content required by the checklist; you will just need to fill in the appropriate page numbers that correspond to the specific content.
Second, there is a section for comments. This section is for your chair to fill in. This part is often used in lieu of a change matrix. While some chairs require both the checklist and a change matrix, they are treated similarly. Do not feel as if you need to transfer the comments from the document into the checklist and the matrix unless you are asked specifically to do so by your chair.
Third, do not overthink the checklist. It is really just used as an extra tool to make sure that you know where everything is in the document and you have checked, double checked, and triple checked each item that is necessary for each section.
Finally, keep in mind that, like your dissertation itself, the checklist is an ever-evolving document. When there are changes made to your document that change the page numbers in the table of contents, those corresponding changes should be made in the checklist as well. Don’t sweat it! You’ve got this!
In the discussion section of your dissertation, one should explain the implications of the results. While many students will often just descriptively repeat the results, chairs are looking for the larger picture when it comes to your findings. As such, this is where your implications come in.
The most important questions to ask yourself when looking at your findings are: why is this important? How do my findings apply to the real world? What are some things that could potentially happen because of this new information? These are the roots of your implications. By highlighting the real-world importance of your findings, you demonstrate the social significance of your study. This is what chairs are looking for.
Implications of the study
Implications not only detail the social significance of your study, but provide realistic methods for addressing the problem you presented within the first chapter of your dissertation. Even if you failed to solve your problem, which often happens, you are still able to talk about why your findings matter in the larger realm of interest on the issue you addressed. If your findings differ from expectations, you’ve opened a new avenue for future research. Implications also serve as a roadmap for individuals involved in public policy decisions, who will apply your findings and explain their importance to the causes they support.
Note that your implications differ from your recommendations for future practice or research, which later sections will discuss. While other sections address shortcomings, implications focus on your study’s strengths: findings, importance, and real-world application.
Need assistance with your research?
Select a time to speak with an expert using the link below

Hope is Evil may seem heretical to those who want to install hope in ourselves and in others. Trained in clinical psychology with a focus on existential philosophy, we instilled hope in clients. I now think that was wrong. What I plan to lay out is a more effective way to respond to the daily challenges of our lives.
In Greek mythology, Pandora opened a box filled with evils, and they flew into the world. As the last evil flew out, Pandora slammed the box shut, leaving hope inside. The evil of hope remains within us. It’s evil for two reasons. First, it creates the illusion of progress while nothing changes. Second, it delays action, relying on false hope. Nothing is going to get better without your action and attention.
The second reason hope is evil is that it distracts, shifting focus away from real action. Constant hoping—whether to graduate, for recovery, weight loss, or the perfect job or relationship—replaces action with waiting. Instead of solving problems, life becomes filled with distractions. These distractions anesthetize us to the beauty and action in the world.
So what’s the choice in lieu of hoping?
I believe its planning, acting, taking account of what’s worked or not. Planning, acting, and taking account all sit in Steven Covey’s quadrant II activities. These activities are important and non-urgent.
Students, instead of hoping for timely revisions, send a friendly reminder about your dissertation schedule. Instead of hoping to lose weight, create and stick to a healthy meal plan. Instead of hoping for a relationship, be the strong, happy person someone is drawn to and stay.
You know what you have to do. Here’s to your action!
Best,
James

PS: I know many of you hope to edit your dissertation alone with minimal revisions. Take action—schedule a no strings attached 30-minute consult now.
Need help conducting your analysis?
Leverage our 30+ years of experience and low-cost same-day service to complete your results today!
Schedule now using the calendar below.
Some schools refer to it as the Audience section; other schools refer to it as the Significance section. Either way, it means the same thing: identifying the people who would care about or benefit from your study findings. In these sections, you need to answer the following questions: To whom may your findings be significant? How can your findings inform practice or future research?
These sections are important because they are related to the reason for conducting your study. Your study should be designed to address your Research Problem. In doing so, you will be collecting knowledge that can add to the literature and inform practice in your discipline. Consequently, it is important that your topic and your focus align with concerns of your discipline drawn from the literature.
In my experience, people are often drawn to a topic that interests them, or that they are familiar with through their occupations, and there is nothing wrong with that. This interest, however, must be relevant to issues or concerns in your field of study and yield information that is relevant to that field.
Sounds simple, right? Well, it is, as long as you keep the significance to your discipline in mind.
For instance, say you were interested in prescription drug abuse because you work in the medical field or the pharmaceutical industry. However, your degree program is public policy and administration. Because your field is policy and administration, your focus should be policy as it relates prescription drug abuse. The literature you would be drawing from and contributing to would be policy literature, not medical or pharmacy literature. Although medical and pharmacy literature might be necessary to contextualize the phenomenon, it would not be your focus and you would not be contributing to it.
It sometimes happens that people’s interest in a topic overshadows their study’s connection to their field. To avoid this, make sure to clearly identify the people who would benefit from your study findings and the field to which you would be contributing.
Conceptual frameworks are necessary components of dissertations that utilize a qualitative methodology. The conceptual framework section should appear in both the introduction and literature review of your dissertation. In your first conceptual framework section, you should spend approximately 1–3 pages introducing your framework. This should be followed by 3–6 pages of detailed analysis in your literature review.
A conceptual framework is a description of research that supports the need for your study.
Framework Development and Research Design Alignment
In composing your framework in the introduction, you should identify the logical connections between tenets of your selected theory and the purpose of your study. This will enable you to justify your selected research design. Be sure to cite scholarly research in this section to support your statements. You must also demonstrate how your framework relates to the approach of your study and your research questions, as well as to the instrument development and data analysis.
Conceptual Framework: Analyzing Theoretical Foundations
In your literature review, your conceptual framework section should be a thorough and detailed analysis of the theory or theories you utilize in your study. This analysis should include the major theoretical propositions or hypotheses made by the theorist(s), as well as a delineation of any assumptions made by the theorist(s). Also important is your discussion of why you selected the theory you are using and how it will benefit your study. As such, you will need to discuss how it relates to your study and your research questions. Be sure to include citations and discussion of at least three or four scholarly sources. These sources should have utilized your selected theory in their studies. It will add to your justification of using the theory in your study. If you have further questions regarding your conceptual framework, or any other components of your dissertation, please consider reaching out to Statistics Solutions. Good luck, and happy writing!
Need help with your project? Leverage our 30+ years of experience and low-cost service to make progress on your results!
Schedule now using the calendar below.
Outliers are values that are abnormally distant from most other values in your dataset. While they can give you valuable insights, they also affect assumption testing and inferential statistics. The removal of outliers is a controversial topic, but most parametric analyses are particularly sensitive to outliers that may unduly influence results.
For example, suppose you were measuring the temperature of several rooms. One room temperature was 75°F, and others were 72°F, 78°F, and 74°F. The mean room temperature would be 74.75 °F. However, suppose you measured a room that was an industrial kitchen, at an uncomfortable 110 degrees. That would move the average up to 81.80°F. Or, perhaps you accidentally entered in a value of 10 instead of 110 for that industrial kitchen. That would move the average to 61.8°F! Despite that the majority of rooms in your sample were comfortably in the 70s, the one extreme value pushed the mean to a level not really representative of your sample.
An outlier can be visually assessed, through scatterplots, boxplots, or histograms. Another preferred way to detect outliers is to create standardized (Z) scores for the variables of interest, and then examine those scores for values that are more than 3.29 standard deviations above or below the mean. If they are beyond ± 3.29 standard deviations from the mean, they are indicative of an associated outlying value (Tabachnick & Fidell, 2013).
Once you have detected your outliers, you should examine them for data entry or measurement errors, such as in the case of the 10°F industrial kitchen. All outliers due to entry or measurement errors should be dropped. If it is not obviously an error, you should examine whether the presence of the outlier creates a significant association, or if it does not change significance but does change the assumption testing results. If does either of those things, you may consider dropping the outlier.
References:
Tabachnick, B. G., & Fidell, L. S. (2013). Using Multivariate Statistics, 6th ed. Boston: Allyn and Bacon.