Knowing where to turn with your formatting questions when composing your dissertation can seem daunting sometimes. Many schools offer templates in which you can simply insert your narrative paragraphs and change preformatted heading text to meet your needs. This makes your job a bit easier to do; but what if you have a school that does not offer a resource such as this? This is where things can start to seem a bit hazy.
If your school does not offer a preformatted template, it may offer some sort of guidelines or guidebook with visual examples. These examples are going to really make or break you when it comes to getting past that chair who is picky about form and style – or for getting through form and style altogether.
There is one big thing to remember: your school requirements will trump APA guidelines every time. However, this does not mean that the feedback that you receive from your chair is gospel. In reality, chairs have personal opinions and interpretations of guidelines that are not always on point. This is where you will need to step up to ensure that the document you are pouring your blood, sweat, and tears into is going to pass muster when it comes to the rest of your committee, IRB, URR, or any other school reviewer. It is your responsibility to know what the school expects as well as what APA requires.
If you are a person who works best with multiple examples, you may find it most useful to use ProQuest to look up published dissertations from your school and degree program. You can also use the APA blog or Purdue Owl (Purdue University’s writing center website) to search specific questions and formatting guidelines.
One last thing to think about is the table of contents. You will notice that there is not a section in the APA handbook for the table of contents. This is because each table of contents is specific to your school, so you should always follow their guidelines and recommendations for this piece of your paper.
[/et_pb_text][/et_pb_column][/et_pb_row]<img src=”https://www.statisticssolutions.com/wp-content/uploads/2017/03/apaeditingbutton.jpg”/>[/et_pb_code][/et_pb_column]<!–> <script charset=”utf-8″ type=”text/javascript” src=”//js.hsforms.net/forms/v2-legacy.js”></script> <!–> <script charset=”utf-8″ type=”text/javascript” src=”//js.hsforms.net/forms/v2.js”></script> <script> hbspt.forms.create({ portalId: ‘256306’, formId: ‘0931ee54-bb0e-4685-8cad-c79eabda0300’ }); </script>[/et_pb_code][/et_pb_column][/et_pb_row][/et_pb_section]
When you complete your dissertation, the discussion chapter calls for you to establish recommendations based on the findings of your study. This can be difficult if you are not sure what to recommend or what colleges are specifically looking for. As such, here are some helpful tips to assist you with recommendations for your discussion.
The best way to tackle your recommendations is to see what limitations were left over at the end of your study. How were you limited? Were you able to successfully accomplish all that you set out to do? Chances are that you were not; through no fault of your own, there were probably some things that did not make the cut or threw your results off. You should base your recommendations on these limitations. The purpose of rooting your recommendations in your limitations is that it allows for future researchers to continue the research that you were unable to continue. It also establishes new gaps within the literature, which allows for the research to be continued to its logical conclusion.
Finally, you want to cater your recommendations to two schools of thought: recommendations for future research and recommendations for future practice. Your recommendations for future research are the things that scholars should focus on drawing out because your research was unable to hit all of the main points of your topic. Your recommendations for future practice are key takeaways for individuals to implement within the real world, allowing you to see your ideas in action. Keeping these points in mind will help you compose a more coherent and comprehensive recommendations section for your discussion chapter.
 Happy November everyone! As Halloween passes, we move on to the festive seasons of Thanksgiving, Hanukkah, Christmas, and New Year’s.
As the end of this year nears, I sincerely wish you well in completing your dissertation. I speak to many doctoral students daily, and I’m surprised as to how many newsletter members don’t reach back out to us. Just this morning I called a woman I hadn’t spoken with in 6 months. Very quickly she explained that she “cannot do it alone”—she needed help, was dragged into two extra classes, but yet, didn’t pick up the phone to ask for help.
Why call? There are three reasons we can help you and make our professional dissertation services affordable:
- We have a team: Our team of 20 specialists know how to make substantive edits and effectively address feedback.
- We have a process: Our process includes a production manager to oversee your project, coordinate teams who communicate with each other about your project, and our in-house rubrics make for a seamless process going through the dissertation. From the editing process to up to 30 hours just for revisions, your success in 2018 is a reality.
- We have 0% financing for 36 months: Investing in dissertation services is just that, an investment. But they have to be affordable. To make services affordable, we offer a manageable deposit and 0% financing for 36 months.
Together, our team, process, and financing lead to less revisions (and frustration), quicker graduation, and paying less tuition. The 45-minute consultation with me is free.
I’ll close by getting back to the holiday theme. Whatever we want, there is one sure way to get it, and that’s to give it. If you want time, money, friendships—then give that more than you have. As the Beatles said in The End, “And in the end, the love you get is equal to the love you give.”
Best,
James Lani, PhD
PS: We’ve developed a new statistics package that provides narratively interpreted output. Try it for free here:
http://analyze.intellectusstatistics.com/login/
I speak with ABD students every day, 5 days a week, for the past 22 years. ABD is the acronym for All But Dissertation. What I’ve learned is that an ABD status is a liability. It’s a liability to you ever completing your degree. There are three big reasons for this: life happens, committees change, and literature reviews get outdated.
Life happens to us all, but when you’re trying to complete your degree, the dissertation can go to the back burner and jeopardize you ever completing it. I have heard about parents’ death, illnesses, job loss, and relocating. While all very important, the dissertation takes longer than it should, extensions get filed, and well, 45% of graduate students remain ABD with lots of credits and debt.
While life is happening to you, it’s happening to your committee too. What happens is that your committee can and do leave, and you wind up starting back with another chairperson who has their own style and idiosyncrasies. I have never in all my years observed students getting through more quickly by having a new chair or committee member—never.
And while life happens and chairs change, your literature review gets out of date. I can understand needing peer-reviewed articles. I can understand wanting a portion of the literature current. But I can’t understand why schools don’t grandfather your articles in when the literature review gets signed off for the first time. It’s double work, an extra quarter, and another $4,000. I might be missing something, but this just seems unreasonable to me.
At the end of the day, the take home message is get out as soon as you can. No one paper has changed the world. The dissertation is an exercise—sometimes anxiety arousing, time-consuming, and expensive exercise—but an exercise in conducting an entire research project, and learning along the way. While my dissertation was part of a solid research program at Miami University in Ohio and I’ve been out of school for 15 years, I haven’t the nerve to see how many times it’s been read by others.
To your graduation,
Best,

James Lani, PhD
So, you have made it to the Discussion section of your dissertation. Great! Now, there are certain components of the Discussion that are fairly standard that you will need to cover. We will focus on the Implications section and explain what it intends to accomplish.
In a way, all the work and research that you have done comes down to the significance of your findings. You have conducted an extensive research project; the results must mean something or be significant to someone. That is where your implications come in.
Implications typically have two prongs: implications for research or theory and implications for practice. If you tested a theory in your study, then you want to discuss the theoretical implications of your study. If your study supported the theory you tested, a theoretical implication would be that the theory is suitable for explaining and understanding the phenomenon you investigated. Or, the theory may be suitable for studying the specific population you studied. If researchers have not applied the theory to the population or setting you studied, a theoretical implication might be that your study may serve as a basis for modifying the theory. The research may partially support the theories, suggesting that researchers need to conduct further studies or modify the theory.
So, you have made it to the Discussion section of your dissertation. Great! Now, there are certain components of the Discussion that are fairly standard that you will need to cover. We will focus on the Implications section and explain what it intends to accomplish.
In a way, all the work and research that you have done comes down to the significance of your findings. You have conducted an extensive research project; the results must mean something or be significant to someone. That is where your implications come in.
Need help with your project? Leverage our 30+ years of experience and low-cost service to make progress on your results!
Schedule now using the calendar below.
Implications typically have two prongs: implications for research or theory and implications for practice. If you tested a theory in your study, then you want to discuss the theoretical implications of your study. If your study supported the theory you tested, a theoretical implication would be that the theory is suitable for explaining and understanding the phenomenon you investigated. Or, the theory may be suitable for studying the specific population you studied. If researchers have not applied the theory to the population or setting you studied, a theoretical implication might be that your study may serve as a basis for modifying the theory. The research may partially support the theories, suggesting that researchers need to conduct further studies or modify the theory.
Implications for practice involve discussing what your findings might mean for individuals who work in your field of study. Think about what people do in your field. What might your findings mean for them and the work they do? How can your findings potentially affect practice? Implications for practice also involve discussing how you can deliver information from your study to practitioners. Consequently, it is appropriate to discuss methods of delivering your findings to practitioners. Of course, your area of practice may in part determine your methods of disseminating knowledge. Typical examples of knowledge dissemination include professional development, training sessions, interventions, and seminars.
Implications, like recommendations for further study, are some of the most important end components of your study. When you interpret your findings, you discuss what your findings mean. In the implications section, you should discuss what your findings mean to the field and to other researchers. You also need to discuss what your findings mean for the people who work in your field of study.
So, you have conducted all your research, answered your research questions, and made your conclusions, but you are not done yet! You still must write your Discussion section. This may feel like a large hurdle to jump after you have already exhausted all of your energy, but you can do it! Below is a basic outline of components of the dissertation discussion for you to follow (but be sure to always follow your school’s template and guidelines).
Your discussion section is your place to reflect on your study; this is where you provide a summary of your findings and discuss how your findings confirm, refute, or expand upon existing knowledge based upon the research conducted and presented in your Literature Review. This chapter is also where you will discuss the limitations to generalizability, trustworthiness, validity, and reliability that affected your study, provide recommendations for further research based on the findings in your study, and make a conclusion that captures the essence of your study for readers. Each of these components can be written as an individual heading within this chapter.
Typically, you should introduce your discussion by summarizing the problem and purpose statements as established in your introduction to the study. Be sure to use the same wording for these statements! While your introduction to the discussion will often be brief, other portions of the discussion will vary in length. For example, the summary of findings will vary greatly in length based on your study and design; the interpretation of the findings typically will be anywhere from three to seven pages long; the discussion of the limitations is usually one page long; recommendations may range from approximately two to four pages; and the conclusion should be a brief wrap-up of the section and the study, which is usually less than a full page.
We at Statistics Solutions wish you the best of luck in composing your discussion section of your dissertation! If you have any questions or need additional guidance with this, or any other component of your dissertation, our team is always happy to help.
Starting on the journey of regression analysis in SPSS after collecting your data is a pivotal moment in any research project. Once you have meticulously prepared your dataset, as outlined in our guide on data cleaning and management in SPSS, you are now ready to dive into the regression analysis. Furthermore, this step not only allows you to explore the relationships between variables but also sets the stage for uncovering meaningful insights. In addition, it helps you test hypotheses and predict outcomes based on your dataset.
As a result, you can move from raw data to actionable conclusions, adding depth to your research. Moreover, understanding the key processes involved will enable you to confidently interpret the results and make informed decisions moving forward. However, diving directly into interpreting the regression results without a proper check on the underlying assumptions can lead to misleading conclusions. Let’s demystify the essential assumptions of normality, linearity, homoscedasticity, and the absence of multicollinearity, guiding you through each step with clarity.
Normality of Residuals:
The foundation of valid regression analysis lies in the normal distribution of residuals—the differences between the observed and predicted values of the dependent variable. To assess this, a normal Predicted Probability (P-P) plot serves as a valuable diagnostic tool. In particular, when the residuals follow a normal distribution, they will align closely with the plot’s diagonal line, indicating that the assumptions of the regression model are met. Additionally, any significant deviations from this line may signal potential issues with the model, such as non-normality or outliers. Therefore, this diagnostic check is crucial for ensuring the accuracy and reliability of your regression analysis. Moreover, if the P-P plot reveals irregularities, it provides a starting point for further model refinement or transformations of the data. We’ll illustrate how to interpret this plot effectively later on.
Need help conducting your regression analysis? Leverage our 30+ years of experience and low-cost, same-day service to complete your results today!
Schedule now using the calendar below.
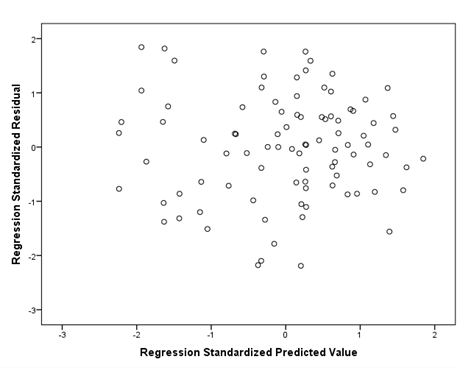
Homoscedasticity:
This assumption concerns the distribution of residuals. To ensure your data is homoscedastic, the residuals should spread evenly across the range of predicted values, resembling a “shotgun blast” of points. This uniform distribution ensures that the variance of errors is constant. Heteroscedasticity, the opposite condition, manifests as a patterned spread of residuals (e.g., cone or fan-shaped), indicating variance inconsistency. We will guide you on how to visually assess homoscedasticity through a scatterplot of predicted values against residuals.
Linearity:
The assumption of linearity posits a direct, straight-line relationship between predictor and outcome variables. If the residuals are normally distributed and exhibit homoscedasticity, linearity typically holds, simplifying the analysis process. Multicollinearity refers to when your predictor variables are highly correlated with each other. This is an issue. This hinders your regression model from linking variance to the correct predictor, leading to muddled results and incorrect inferences. Keep in mind that this assumption is only relevant for a multiple linear regression, which has multiple predictor variables. If you are performing a simple linear regression (one predictor), you can skip this assumption.
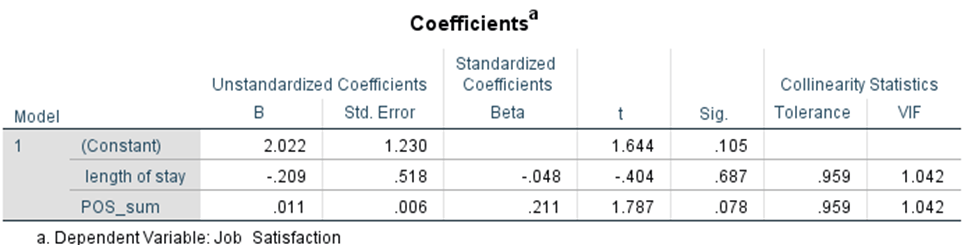
Absence of Multicollinearity:
In multiple linear regression, where several predictor variables are involved, multicollinearity can obscure the distinct impact of each predictor. This phenomenon occurs when predictors highly correlate with one another, complicating the attribution of variance in the outcome variable. Multicollinearity assessment can be approached through two methods:
- Correlation Coefficients: By constructing a correlation matrix among predictors, coefficients nearing or exceeding .80 indicate strong correlations, suggesting multicollinearity.
- Variance Inflation Factor (VIF): VIF values offer a quantitative measure of multicollinearity, with values below 5.00 indicating minimal concern, and those exceeding 10.00 signaling significant multicollinearity.
To fully check the assumptions of the regression using a normal P-P plot, a scatterplot of the residuals, and VIF values, bring up your data in SPSS and select Analyze –> Regression –> Linear. Set up your regression as if you were going to run it by putting your outcome (dependent) variable and predictor (independent) variables in the appropriate boxes.
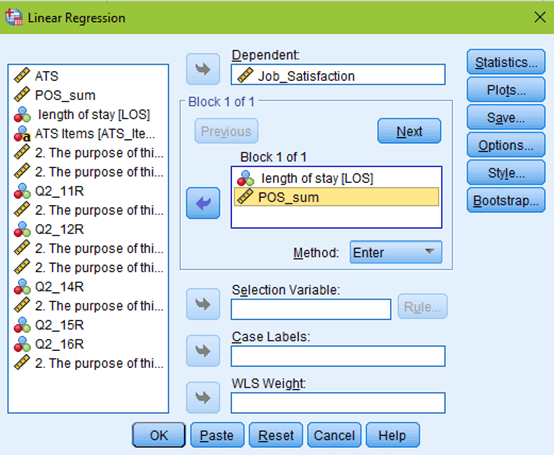
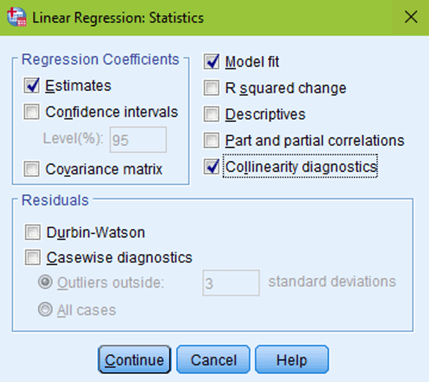
But don’t click OK yet! Click the Statistics button at the top right of your window. Estimates and model fit should automatically be checked. Now, click on collinearity diagnostics and hit continue.
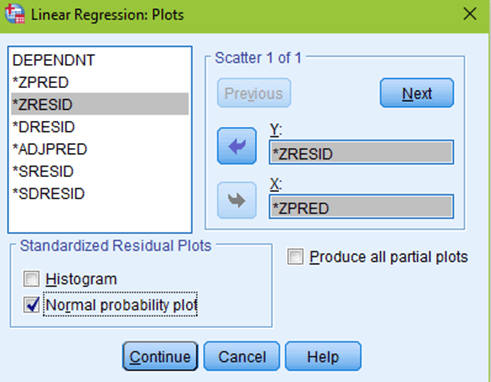
The next box to click on would be Plots. You want to put your predicted values (*ZPRED) in the X box. And your residual values (*ZRESID) in the Y box. Make sure to check the normal probability plot, then click continue.
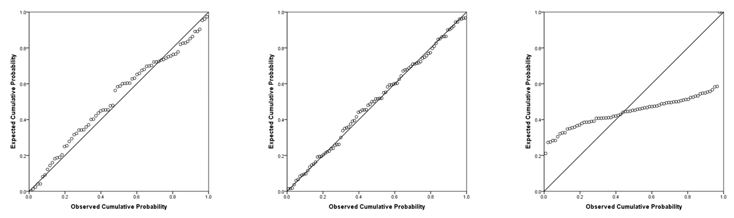
Now you are ready to hit OK! You will get your normal regression output, but you will see a few new tables and columns, as well as two new figures. First, you will want to scroll all the way down to the normal P-P plot. You will see a diagonal line and a bunch of little circles. Ideally, your plot will look like the two leftmost figures below. If your data is not normal, the little circles will not follow the normality line, such as in the figure to the right. Sometimes, there is a little bit of deviation, such as the figure all the way to the left. That is still ok; you can assume normality as long as there are no drastic deviations.
Evaluation of Homoscedasticity
The next assumption to check is homoscedasticity. The scatterplot of the residuals will appear right below the normal P-P plot in your output. Ideally, you should see a plot that, in this case, looks similar to the one below. The data looks like you shot it out of a shotgun—it does not have an obvious pattern, there are points equally distributed above and below zero on the X axis, and to the left and right of zero on the Y axis.
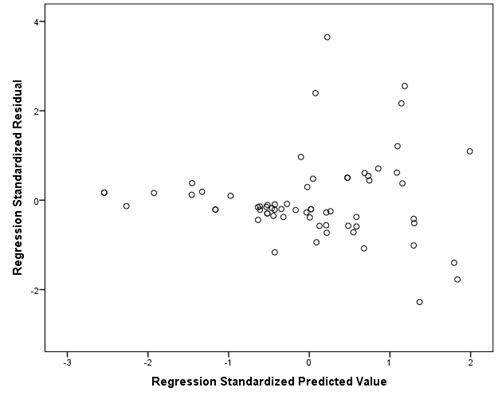
If your data is not homoscedastic, it might look something like the plot below. The plot shows a tight distribution on the left and a wide distribution on the right. If you were to draw a line around your data, it would look like a cone.
Evaluation of multicollinearity
Finally, you want to check absence of multicollinearity using VIF values. Scroll up to your Coefficients table. All the way at the right end of the table, you will find your VIF values. Each value falls below 10, confirming that it met the assumptions.
Report your assumption checking results in the results chapter, following school guidelines and committee preferences for detail. Err on the side of caution by including APA-formatted figures and VIF values in your results chapter. After testing these assumptions, you will be ready to interpret your regression!
Conduct and Interpret Your Analysis Quickly with Intellectus Statistics
Intellectus Statistics allows you to conduct and interpret your analysis in minutes. The system pre-loads assumptions and provides output in APA style, complete with tables and figures. Create a free account and start analyzing your data now!
Researchers analyze qualitative data in various ways to generate findings, but some analysis plans apply specifically to certain qualitative research designs. In phenomenology, the Modified Van Kaam approach, popularized by Moustakas, serves as the primary data analysis plan. This method stands out for its detailed analysis requirements.
Steps in the Modified Van Kaam Analysis
The Modified Van Kaam analysis includes several essential steps. First, researchers must step outside themselves through bracketing and imaginative variation, enabling them to examine the data from different perspectives. Next, they follow a structured process to analyze each interview. Finally, since each interview serves as its own dataset, researchers ensure a thorough and detailed analysis. For example, if you have ten participants, you will perform steps 1 through 6 for each participant.
Need help conducting your analysis? Leverage our 30+ years of experience and low-cost same-day service to make progress on your results today!
Schedule now using the calendar below.
Horizontalization:
- Treat all the data equally, no quote or excerpt is more important than any other. Begin preliminary coding by listing every relevant quote related to the experience or phenomenon.
Reduction and elimination:
This is when you take the list of every quote and begin to ask yourself two questions:
- (1) Is this quote important to the participant’s lived experience of the phenomenon?; and
- (2) Can this quote be reduced to its latent meaning? If you answer no to any of these questions, then the quote is eliminated. This helps separate the invariant constituents of the experience from redundant and ancillary information.
Thematize the Invariant Constituents:
- Take the excerpts that passed the two-question test, explore their latent meanings, and group them accordingly. The groupings form the themes that express the experience for each participant.
Checking the Themes Against the Data:
- After you have generated your themes, you begin to examine the themes against the dataset. This is to make sure that your themes are representative of the participant’s experience and help tell the participant’s story.
- Create Individual Textural Descriptions: For each participant, you will create individual textural descriptions. These are descriptions that utilize verbatim excerpts and quotes from the participant.
- Create Individual Structural Descriptions: Using imaginative variation is crucial for this step. For each participant, you create individual structural descriptions. These are descriptions that examine the emotional, social, and cultural connections between what participants say. This is where the primary interpretation of the data comes into play.
- Create Composite Textural Descriptions: In this step, you should create a table outlining all the themes from each participant. This will help you outline the reoccurring and prominent themes across all the participants, which is what you need. This composite description summarizes participants’ interviews and highlights common themes of their lived experiences.
- Create Composite Structural Descriptions: This is where you examine the emotional, social, and cultural connections of participants experiences across all the participants. This is where you describe common elements of their experiences. Maybe participants came from low socioeconomic backgrounds; maybe participants were from a certain race. Only the consideration of common elements matters, not their specifics. This is where you begin to conceptualize what elements factor the most into their experiences and what elements inform their experiences.
- Create a Composite Structural-Textural Description: This step is also referred to as a Synthesis. This is where you begin to merge both the textural and the structural to give a comprehensive understanding about the phenomenon. This is what boils down the lived experience of the phenomenon.
Length and Integrity in Modified Van Kaam Analysis
It is very common for the results section of a Modified Van Kaam analysis to be over a hundred pages. Despite the length, maintaining the integrity of participants’ voices is crucial, making this analysis plan ideal for phenomenological research. It provides a rich understanding of participants’ lived experiences of the phenomenon without altering their narrative, experiences, and stories. It allows qualitative researchers to deeply explore the participants’ lived experiences in order to understand the essence of the phenomenon through the voices of those who lived it.
Using secondary sources should be minimum in scholarly writing, but it is first important to understand and recognize what a secondary source is. A secondary source may found quoted or referenced in another source. For example, if you read a research article by Smith (2014) where Smith quotes or refers to information from Jenkins (2006), citing Jenkins in your work would be a secondary source—you would be citing Smith’s reference to Jenkins’ research, not Jenkins’ original work.
Writers should avoid citing secondary sources for a variety of reasons. For one, if the original source is easy to access or find, then citing another source to refer to the original may be a sign of laziness to readers. Citing the original source shows that you, the researcher, are heavily invested in and knowledgeable of the main research in your field. Reading the full, original source may reveal additional insight, information, or context. Last, exhausting the sources pertaining to your topic will make you a more informed, credible researcher in your field.
However, there are some instances when the original source is unable to be found or accessed. For example, the source may be out-of-print, is a personal correspondence, or is not available in English. In such cases, follow the APA guideline for citing secondary sources:
In text Citation
Jenkins (as cited in Smith, 2014) stated . . .
Reference List
Smith, A. B. (2014). Title of article. Journal Name, 1(2) 3–4.
In the reference list entry, you want to cite the actual source that you accessed (such as Smith, 2014), not the one you are referring to as a secondary source. For more information on secondary sources, refer to page 175 of the APA manual (6th edition). The general takeaway, however, is to use secondary sources sparingly.
Need assistance with your research?
Schedule a meet to speak with an expert using the link below
Hypotheses are testable statements that link to your research question. Hypotheses link the research question to concise statements about the connection between variables. For example, if studying how mentoring affects first-generation students’ intention to stay at university, the research question could be:
“Does the presence of a mentoring relationship influence first-generation students’ intentions to remain at their university?”
Though this statement outlines the construct and variables, it doesn’t specify what we’re testing. We use the hypotheses to make this clear. Specifically, we create null and alternate hypotheses to indicate exactly what we intend to test. The null hypothesis suggests no observable difference or relationship, while the alternate hypothesis suggests there is one.
In the example above, itwould be as follows:
Null hypothesis: The presence of a mentoring relationship does not influence first-generation students’ intention to remain at their university.
Alternate hypothesis: The presence of a mentoring relationship influences first-generation students’ intention to remain at their university.
Need help conducting your analysis? Leverage our 30+ years of experience and low-cost same-day service to complete your results today!
Schedule now using the calendar below.
It may be worded with or without a direction. As written above, it does not have a direction. To give them direction, we would consult previous literature to determine how a mentoring relationship is likely to influence intention to remain in school. If the research indicates that the presence of a mentoring relationship should increase students’ connections to the university and their willingness to remain, our alternate hypothesis would state:
“The presence of a mentoring relationship increases first-generation students’ intention to remain at their university.”
If the research indicates that the presence of a mentoring relationship minimizes students’ desire to make additional connections to the university and in turn decreases their willingness to remain, it would state:
“The presence of a mentoring relationship decreases first-generation students’ intention to remain at their university.”
Once you conduct your statistical analysis you will determine if it should be rejected in favor of the alternate hypothesis.