Understanding the Wilcoxon Signed Rank Test
The Wilcoxon signed rank test serves as the non-parametric counterpart to the dependent samples t-test, specifically designed for situations where the assumptions of the latter, particularly regarding metric (interval or ratio) and normally distributed data, are not met. This test is particularly useful when dealing with ranked or ordinal data, making it an excellent alternative for analyzing repeated measures or paired observations without requiring the data to follow a normal distribution.
Key Features of the Wilcoxon Signed Rank Test
- Non-parametric Nature: The test does not assume multivariate normality of the data, making it suitable for ordinal data or data that do not meet the normal distribution criteria.
- W-Statistic: The test calculates the W-statistic, which, for sample sizes larger than 10 paired observations, approximates a normal distribution, facilitating the interpretation of results.
Application Scenario: Evaluating a New Teaching Method
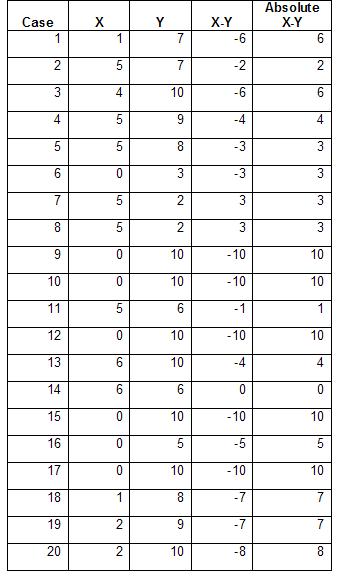
A research team aims to assess the effectiveness of a novel teaching method on improving children’s literacy levels. They conduct a study involving 20 children, measuring literacy on a 0 to 10 scale both before and after implementing the teaching method. The pre-intervention average literacy score stands at 5.9, which then rises to 7.6 post-intervention.
Given the nature of the data and its distribution not approximating a normal distribution, the Wilcoxon signed rank test is identified as the most appropriate statistical method for this analysis. This choice is reinforced by the paired nature of the measurements (pre- and post-intervention scores), which renders independent tests like the Mann-Whitney U-test unsuitable.
Conducting the Wilcoxon Signed Rank Test: Step-by-Step
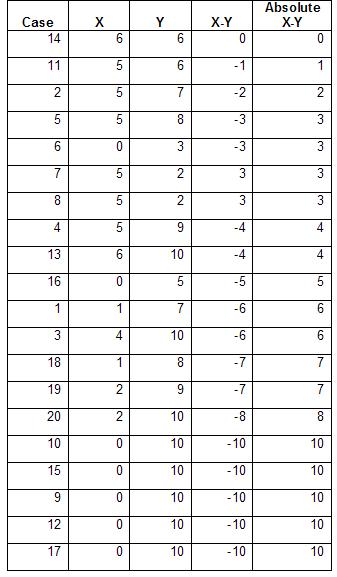
Rank the Differences: Compute the differences between the paired observations (pre- and post-scores), and rank these differences based on their absolute values, disregarding the sign (positive or negative).
Assign Signs to Ranks: Reintroduce the signs (positive or negative) to the ranks based on the direction of the difference (whether the post-score was higher or lower than the pre-score).
Calculate the W-Statistic: Sum the ranks for positive differences and for negative differences separately. The W-statistic is the smaller of these two sums, which is then used to assess the significance of the observed differences.
Interpret the Results: Using the calculated W-statistic, determine whether the literacy scores have significantly changed post-intervention, based on a predefined significance level (e.g., α = 0.05).
Need help with your research?
Schedule a time to speak with an expert using the calendar below.
User Friendly Software
Transform raw data to written, interpreted, APA formatted Wilcoxon Signed Rank Test results in seconds.
Conclusion
The Wilcoxon signed rank test offers a robust alternative to the dependent samples t-test when the data do not meet the latter’s assumptions. It allows researchers to effectively analyze changes in ordinal data or non-normally distributed metric data from repeated measures or paired observations. Through its application in the given scenario, the research team can conclude whether the new teaching method has a statistically significant effect on children’s literacy levels, providing valuable insights into its efficacy.
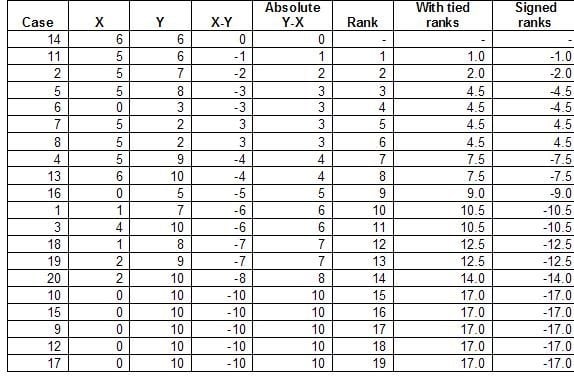
The first step of the Wilcoxon sign test is to calculate the differences of the repeated measurements and to calculate the absolute differences.
The next step of the Wilcoxon sign test is to sign each rank. If the original difference < 0 then the rank is multiplied by -1; if the difference is positive the rank stays positive.
For the Wilcoxon signed rank test we can ignore cases where the difference is zero. For all other cases we assign their relative rank. In case of tied ranks the average rank is calculated. That is if rank 10 and 11 have the same observed differences both are assigned rank 10.5.
The next step of the Wilcoxon sign test is to sign each rank. If the original difference < 0 then the rank is multiplied by -1; if the difference is positive the rank stays positive.
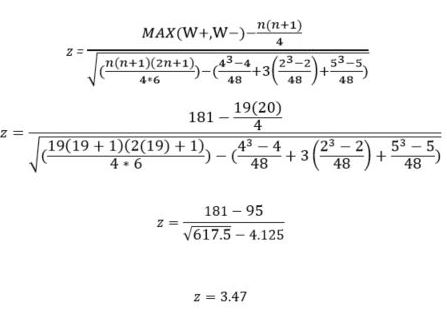
The next step is to calculate the W+ and W-.
W+ = 4.5 + 4.5 = 9
W- = 1+ 2 + 4.5 + 4.5 + 7.5 + 7.5 + 9 + 10.5 + 10.5 + 12.5 + 12.5 + 14 + 17+ 17 + 17 + 17 + 17 = 181
We can double check this knowing ![]()
Therefore, ![]() and
and ![]()
For large samples with n>10 the W-statistics approximates normal distribution, with ![]()
Further, we must make a compensation for ties, 4, 2, 2, 2, and 5, so we must reduce the variance by ![]()
The shortcut to the hypothesis testing of the Wilcoxon signed rank-test is knowing the critical z-value for a 95% confidence interval (or a 5% level of significance) which is z = 1.96 for a two-tailed test and directionality. Whenever a test is based the normal distribution the sample z value needs to be 1.96 or higher to reject the null hypothesis.
Take the Course: Wilcoxon Signed Rank Test