Logistic Regression
Logistic regression is an extension of multiple linear regressions, where the dependent variable is binary in nature. It predicts the discreet outcome, such as group membership, from a set of variables that may be continuous, discrete, dichotomous, or of any other type. Logistic regression is an extension of discriminant analysis. Discriminant analyses also predict the group memberships of the dependent variable. However, in discriminant analysis, there is an assumption of the relationship between the normal and linear distribution. Often, assumptions of equal variance do not meet. But there is no assumption related to normal distribution, linear relationship, and equal variance in logistic regression. There may be many independent variables, like multiple-linear regressions.
Statistics Solutions can help with logistic regression and additional dissertation statistics, use the calendar below to schedule a free 30-minute consultation.

Discover How We Assist to Edit Your Dissertation Chapters
Aligning theoretical framework, gathering articles, synthesizing gaps, articulating a clear methodology and data plan, and writing about the theoretical and practical implications of your research are part of our comprehensive dissertation editing services.
- Bring dissertation editing expertise to chapters 1-5 in timely manner.
- Track all changes, then work with you to bring about scholarly writing.
- Ongoing support to address committee feedback, reducing revisions.
The model:
In logistic regression, the dependent variable is dichotomous. We can take the value of 1 with the probability of success q and or the value 0, with the probability of failure 1- q. When there are two dependent variable categories, then it is said to be binary. When there are more than two dependent variable categories, then it is a form of multinomial. Symbolically, the probability of the dependent variable can be measured by using the following formula:
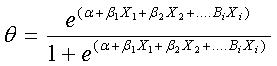
Where α= the constant of the equation and β= the coefficient of the predictor variable. An alternative form of logistic regression can be represented as the following:

Logistic regression has two main uses. The first use is that it predicts group membership. Second, it tells us about the relationship and strengths among the variables.
Test statistics in logistics:
1. Wald statistics: In logistic regression, Wald statistics is used to test the significance of each variable. Wald statistics is simply the Z statistics, which is simply described as the following:
After squaring the Z value, it follows the chi-square distribution. In the case of a small sample size, the likelihood ratio test is more suitable than Wald statistics in logistic regression.
2. Likelihood ratio: The Likelihood ratio test maximizes the value of the likelihood function for the full model. Symbolically it is as follows: 
After the log transformation, the likelihood ratio test follows the chi-square distribution. In logistic regression, it is suggested that the likelihood ratio test is used for significance when we are using backward stepwise elimination.
3. Goodness of fit: In logistic regression, goodness of fit is measured by the Hosmer-lemshow test statistics. This statistic basically compares the observed and predicted observation for the goodness of fit model.
Logistic regression and statistical software: Most software, like SPSS, STATA, SAS, and MATLAB, etc. have the option of performing logistic regression. In SAS, there is a procedure. SPSS is GUI software and it has the option to perform logistic regression. To perform this in SPSS, select the analysis menu from SPSS and select “binary logistic regression” from the options. If the dependent variable has more than two categories, then select the “multinomial model” from the regression option. If data are in order, then select the “ordinal logistic regression” from the regression option. After clicking on the logistic regression, select “binary variable” as the dependent variable, “others” as the continuous variables and “dichotomous variable” as the independent variable. After selecting the dependent and independent variable, select the model for logistic regression. The user can select to see both backward and forward methods in logistic regression.