Implementing the Wilcoxon Signed Rank Test in SPSS
The Wilcoxon Signed Rank Test is a powerful non-parametric statistical method utilized for comparing the medians of two related samples. It’s particularly advantageous for analyzing metric (interval or ratio) data that do not adhere to a multivariate normal distribution, or for datasets that are ranked/ordinal. Serving as the non-parametric counterpart to the dependent samples t-test, the Wilcoxon Signed Rank Test evaluates the null hypothesis that the median difference between the two dependent samples is zero.
Step-by-Step Guide to Running the Wilcoxon Signed Rank Test in SPSS
Following the educational research example, where a team aims to assess the impact of a new teaching method on children’s literacy scores, we outline the process to conduct the Wilcoxon Signed Rank Test in SPSS:
- Data Entry: Input the pre- and post-intervention literacy scores into two separate columns in SPSS. Each row should correspond to a child’s scores before and after the intervention, ensuring the pairs are accurately matched.
- Test Selection:
- Navigate to the SPSS menu and select
Analyze. - Choose
Nonparametric Testsand thenRelated Samples...from the drop-down menu. This pathway is designed for analyses involving paired or related samples, fitting the criteria for the Wilcoxon test.
- Navigate to the SPSS menu and select
- Setting Up the Test:
- In the dialog box that appears, add the pre- and post-intervention literacy score variables to the test pairs list. This action specifies the two related samples that you wish to compare.
- Ensure that the Wilcoxon Signed Rank Test is selected as the test type. This option is typically available under the test choice section or similar, depending on the SPSS version.
- Running the Test: After setting up the test parameters, click
OKto run the analysis. SPSS will calculate the test statistic, taking into account the ranks of the differences between the paired scores, and assess whether the observed differences significantly deviate from zero. - Interpreting Results:
- SPSS will provide output including the W statistic, significance value (p-value), and sometimes the mean ranks and sum of ranks for positive and negative differences.
- A p-value less than the chosen significance level (commonly 0.05) indicates a rejection of the null hypothesis, suggesting a significant difference in literacy scores pre- and post-intervention, attributable to the teaching method.
Understanding the Outcome
By employing the Wilcoxon Signed Rank Test, researchers circumvent the limitations associated with normal distribution assumptions required by parametric tests. This makes it especially useful in educational research and similar fields where ordinal scales and non-normal distributions are common. In the given example, successfully running the Wilcoxon test in SPSS allows the research team to conclude whether the new teaching method significantly impacts literacy scores, providing evidence-based insights into the method’s effectiveness.
This SPSS implementation guide facilitates a straightforward approach to conducting the Wilcoxon Signed Rank Test, enabling researchers to analyze dependent samples with ease and confidence, even in the absence of normal distribution prerequisites.
Wilcoxon Sign Test help?
Option 1: User-friendly Software
Transform raw data to written interpreted results in seconds.
Option 2: Professional Statistician
Collaborate with a statistician to complete and understand your results.
In SPSS we need to have two variables representing the before and after measurements.
The Wilcoxon sign test can be found in Analyze/Nonparametric Tests/2 Related Samples…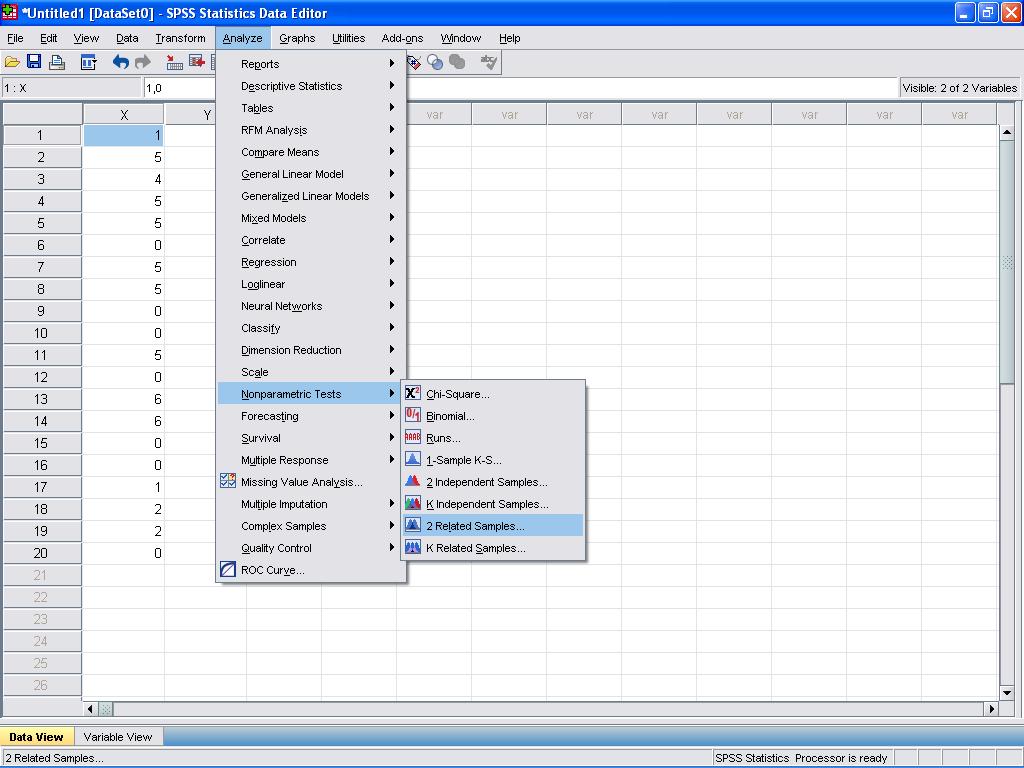
In the next dialogue box for the nonparametric two dependent samples tests we need to define the paired observations. Enter X as variable 1 of the first pair and Y as Variable 2 of the first pair.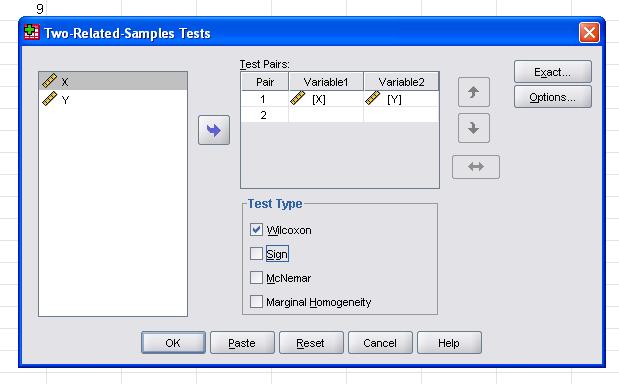
We also need to select the Test Type. The Wilcoxon Signed Rank Test is marked by default.
Wilcoxon – The Wilcoxon signed rank test has the null hypothesis that both samples are from the same population. The Wilcoxon test creates a pooled ranking of all observed differences between the two dependent measurements. It uses the standard normal distributed z-value to test of significance.
Sign – The sign test has the null hypothesis that both samples are from the same population. The sign tests compares the two dependent observations and counts the number of negative and positive differences. It uses the standard normal distributed z-value to test of significance.
McNemar – The McNemar test has the null hypothesis that differences in both samples are equal for both directions. The test uses dichotomous (binary) variables to test whether the observed differences in a 2×2 matrix including all 4 possible combinations differ significantly from the expected count. It uses a Chi-Square test of significance.
Marginal Homogeneity – The marginal homogeneity test has the null hypothesis that the difference in both samples are equal in both directions. The test is similar to the McNemar test, but it uses nominal variables with more than 2 levels. It tests whether the observed differences in a n*m matrix including all possible combinations differ significantly from the expected count. It uses a Chi-Square test of significance.
We select Wilcoxon to calculate the Wilcoxon signed rank test.
If the values in the sample are not already ranked. SPSS will sort the observations according to the test variable and assign ranks to each observation, correcting for tied observations.
The dialogue box Exact… allows us to specify an exact test of significance and the dialogue box Options… defines how missing values are managed and if SPSS should output additional descriptive statistics.
The SPSS Syntax for the Wilcoxon test is
NPAR TESTS
/WILCOXON=X WITH Y (PAIRED)
/MISSING ANALYSIS.
The Wilcox sign test output contains only two tables.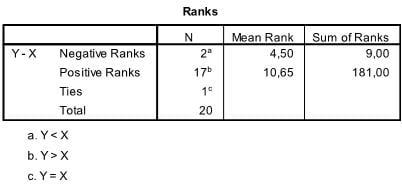
The first table contains all statistics that are required to calculate the Wilcoxon signed ranks test’s W. These are the sample size and the sum of ranks. It also includes the mean rank, which is not necessary to calculate the W-value but helps with the interpretation of the data.
In our example we see that 20*2 observations were made for X and Y. The Wilcox Sign Test answers the question if the difference is significantly different from zero, and thus if the observed difference in mean ranks (4.5 vs. 10.65) can also be found in the general population.
The answer to this question is in the second table, which contains the test of significance statistics.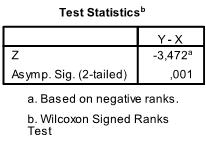
The SPSS output contains the z-value of -3.472. The test value z is approximately normally distributed for large samples that are n>10, so that p = 0.001.
A write-up of the test could be
20 pupils learned reading with a novel method. A before and after measurement of the literacy of each student was taken on a scale, where 0 = little literacy to 10 = high literacy. The results seem to indicate that the after measurements show an increase literacy (average rank of 4.5 vs. average rank of 10.65). The Wilcoxon signed rank test shows that the observed difference between both measurements is significant. Thus we can reject the null hypothesis that both samples are from the same population, and we might assume that the novel teaching method caused a significant increase in literacy scores.